
Make data quality everyone’s business
Enable real-time accessibility to data quality metrics throughout the entire organization, catering to both technical and non-technical users.


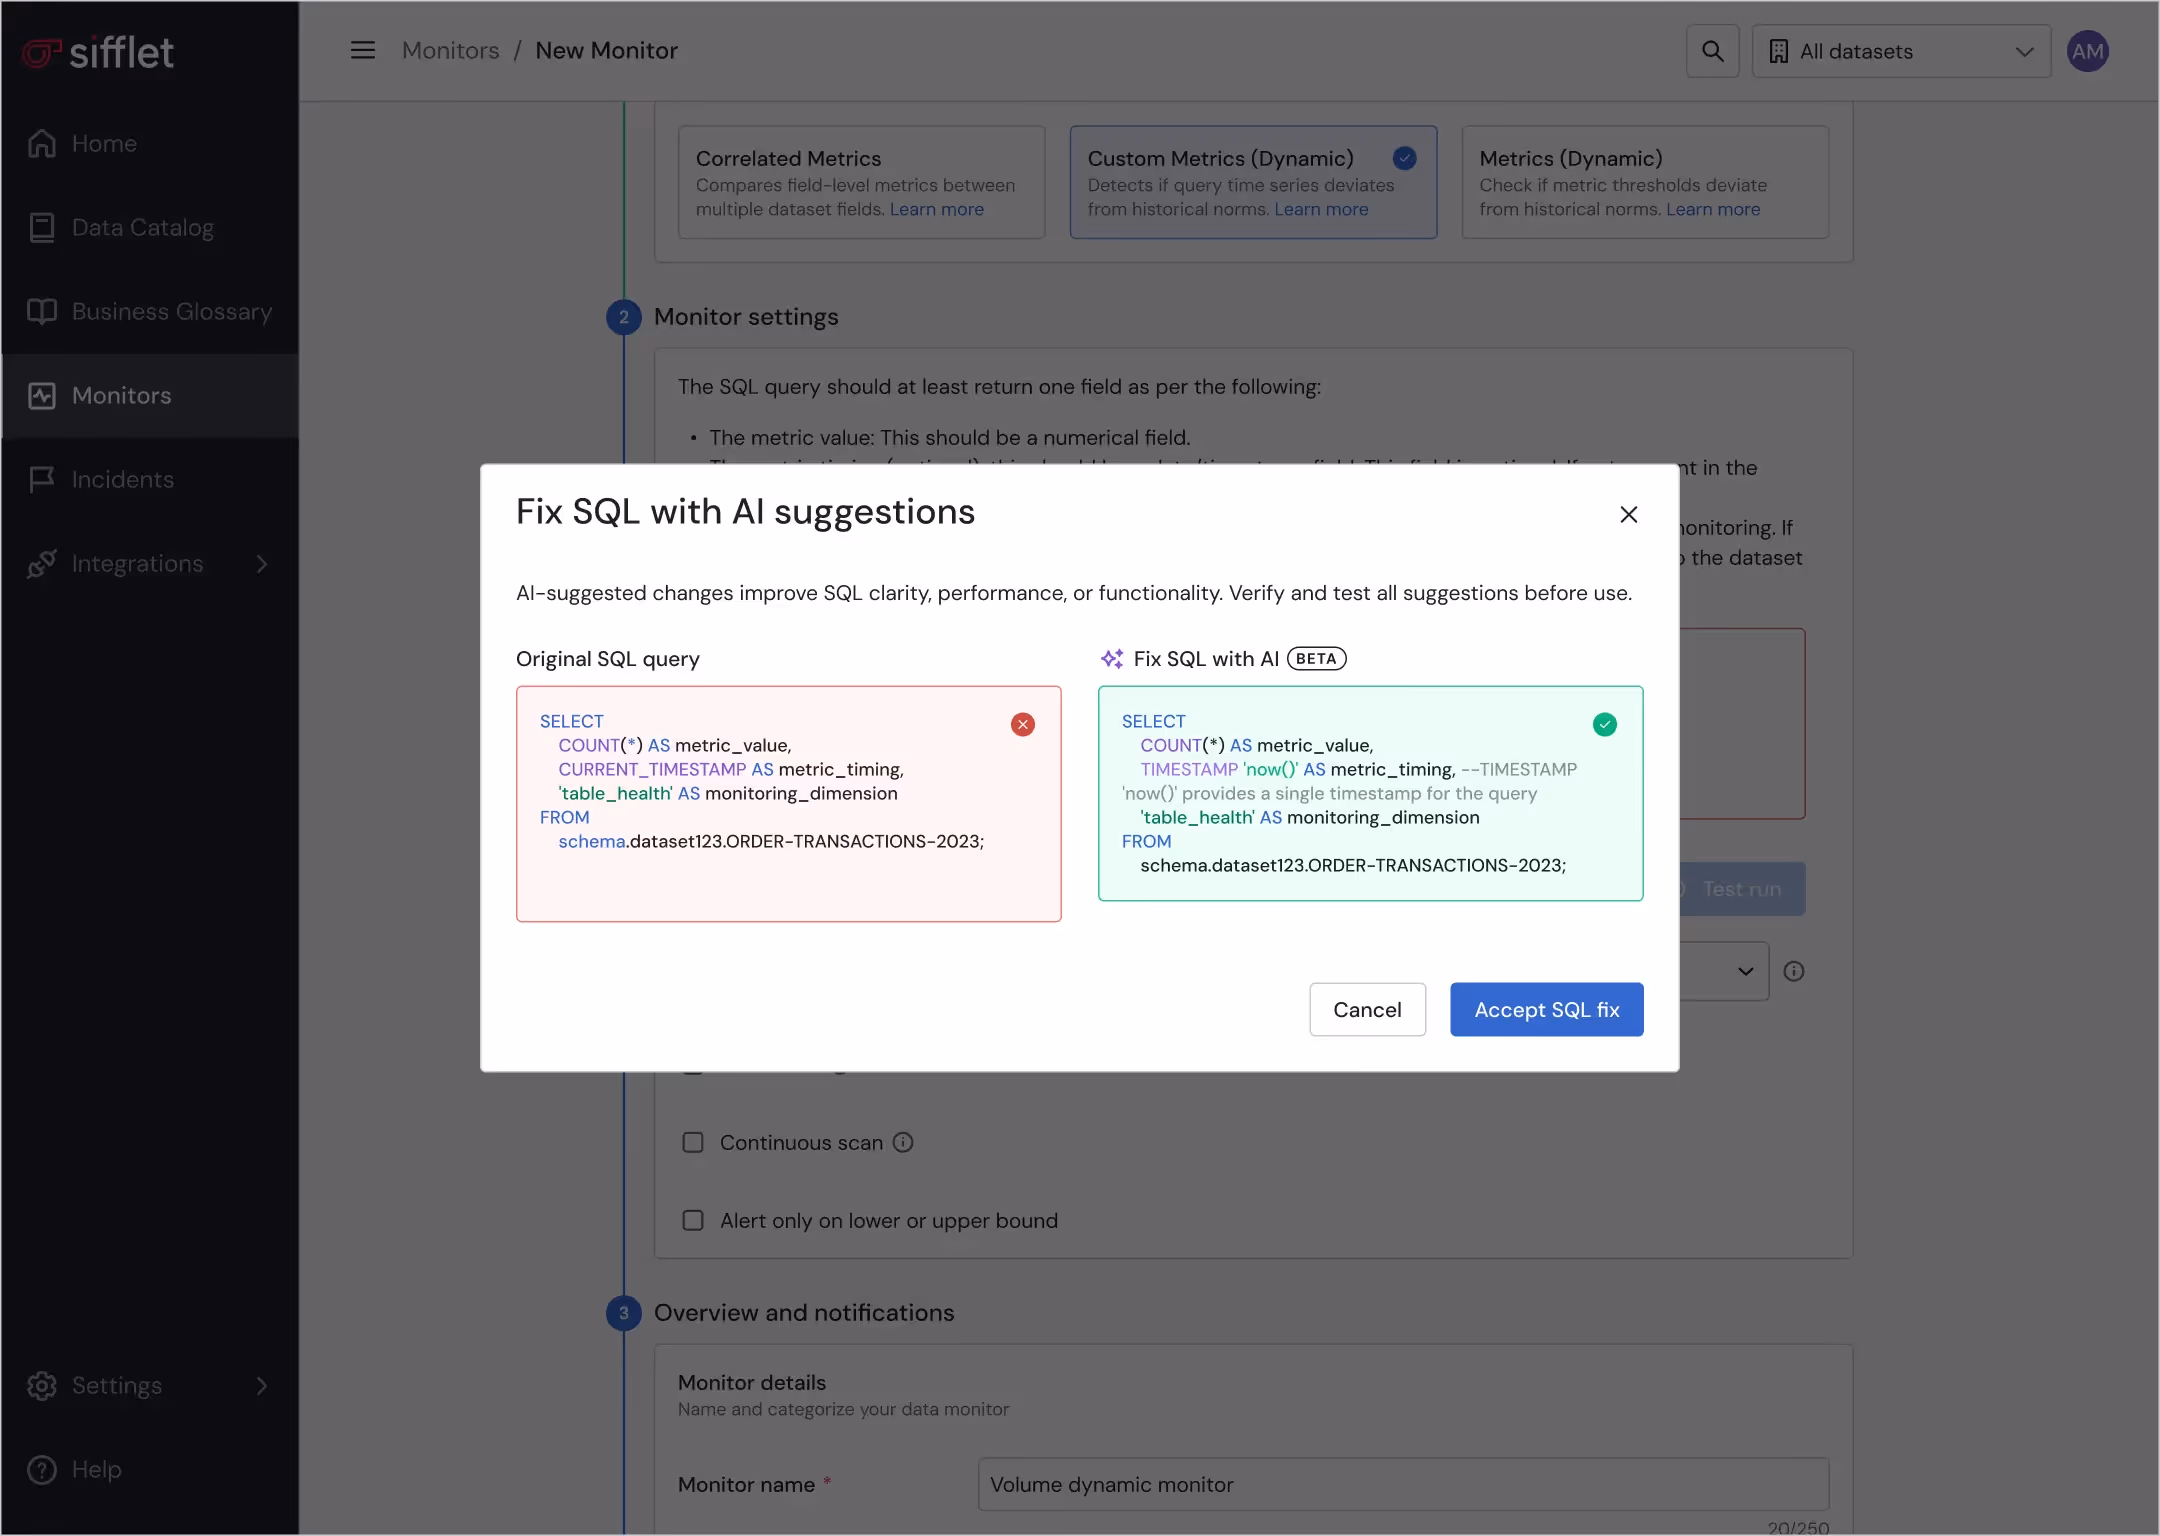
Streamlined monitoring experience
- Collect assets spanning the entire data lifecycle thanks to built-in integrations
- Enable non technical users to create business-informed monitors thanks to an intuitive UI and to the Sifflet AI Assistant
Improved information accessibility
- Access assets’ health status through the Data Catalog and lineage for de-risked data self-service
- Get notified of upstream incidents directly on BI tools via a browser extension

Sifflet’s AI Helps Us Focus on What Moves the Business
What impressed us most about Sifflet’s AI-native approach is how seamlessly it adapts to our data landscape — without needing constant tuning. The system learns patterns across our workflows and flags what matters, not just what’s noisy. It’s made our team faster and more focused, especially as we scale analytics across the business.


"Enabler of Cross Platform Data Storytelling"
"Sifflet has been a game-changer for our organization, providing full visibility of data lineage across multiple repositories and platforms. The ability to connect to various data sources ensures observability regardless of the platform, and the clean, intuitive UI makes setup effortless, even when uploading dbt manifest files via the API. Their documentation is concise and easy to follow, and their team's communication has been outstanding—quickly addressing issues, keeping us informed, and incorporating feedback. "

"Building Harmony Between Data and Business With Sifflet"
"Sifflet serves as our key enabler in fostering a harmonious relationship with business teams. By proactively identifying and addressing potential issues before they escalate, we can shift the focus of our interactions from troubleshooting to driving meaningful value. This approach not only enhances collaboration but also ensures that our efforts are aligned with creating impactful outcomes for the organization."

" Sifflet empowers our teams through Centralized Data Visibility"
"Having the visibility of our DBT transformations combined with full end-to-end data lineage in one central place in Sifflet is so powerful for giving our data teams confidence in our data, helping to diagnose data quality issues and unlocking an effective data mesh for us at BBC Studios"

"Sifflet allows us to find and trust our data"
"Sifflet has transformed our data observability management at Carrefour Links. Thanks to Sifflet's proactive monitoring, we can identify and resolve potential issues before they impact our operations. Additionally, the simplified access to data enables our teams to collaborate more effectively."

"A core component of our data strategy and transformation"
"Using Sifflet has helped us move much more quickly because we no longer experience the pain of constantly going back and fixing issues two, three, or four times."

Discover more title goes here
Frequently asked questions
Get in touch CTA Section
Lorem ipsum dolor sit amet, consectetur adipiscing elit, sed do eiusmod tempor incididunt ut labore et dolore magna aliqua.


-p-500.png)
