
Proactive access, quality and control
Empower data teams to detect and address issues proactively by providing them with tools to ensure data availability, usability, integrity, and security.


De-risked data discovery
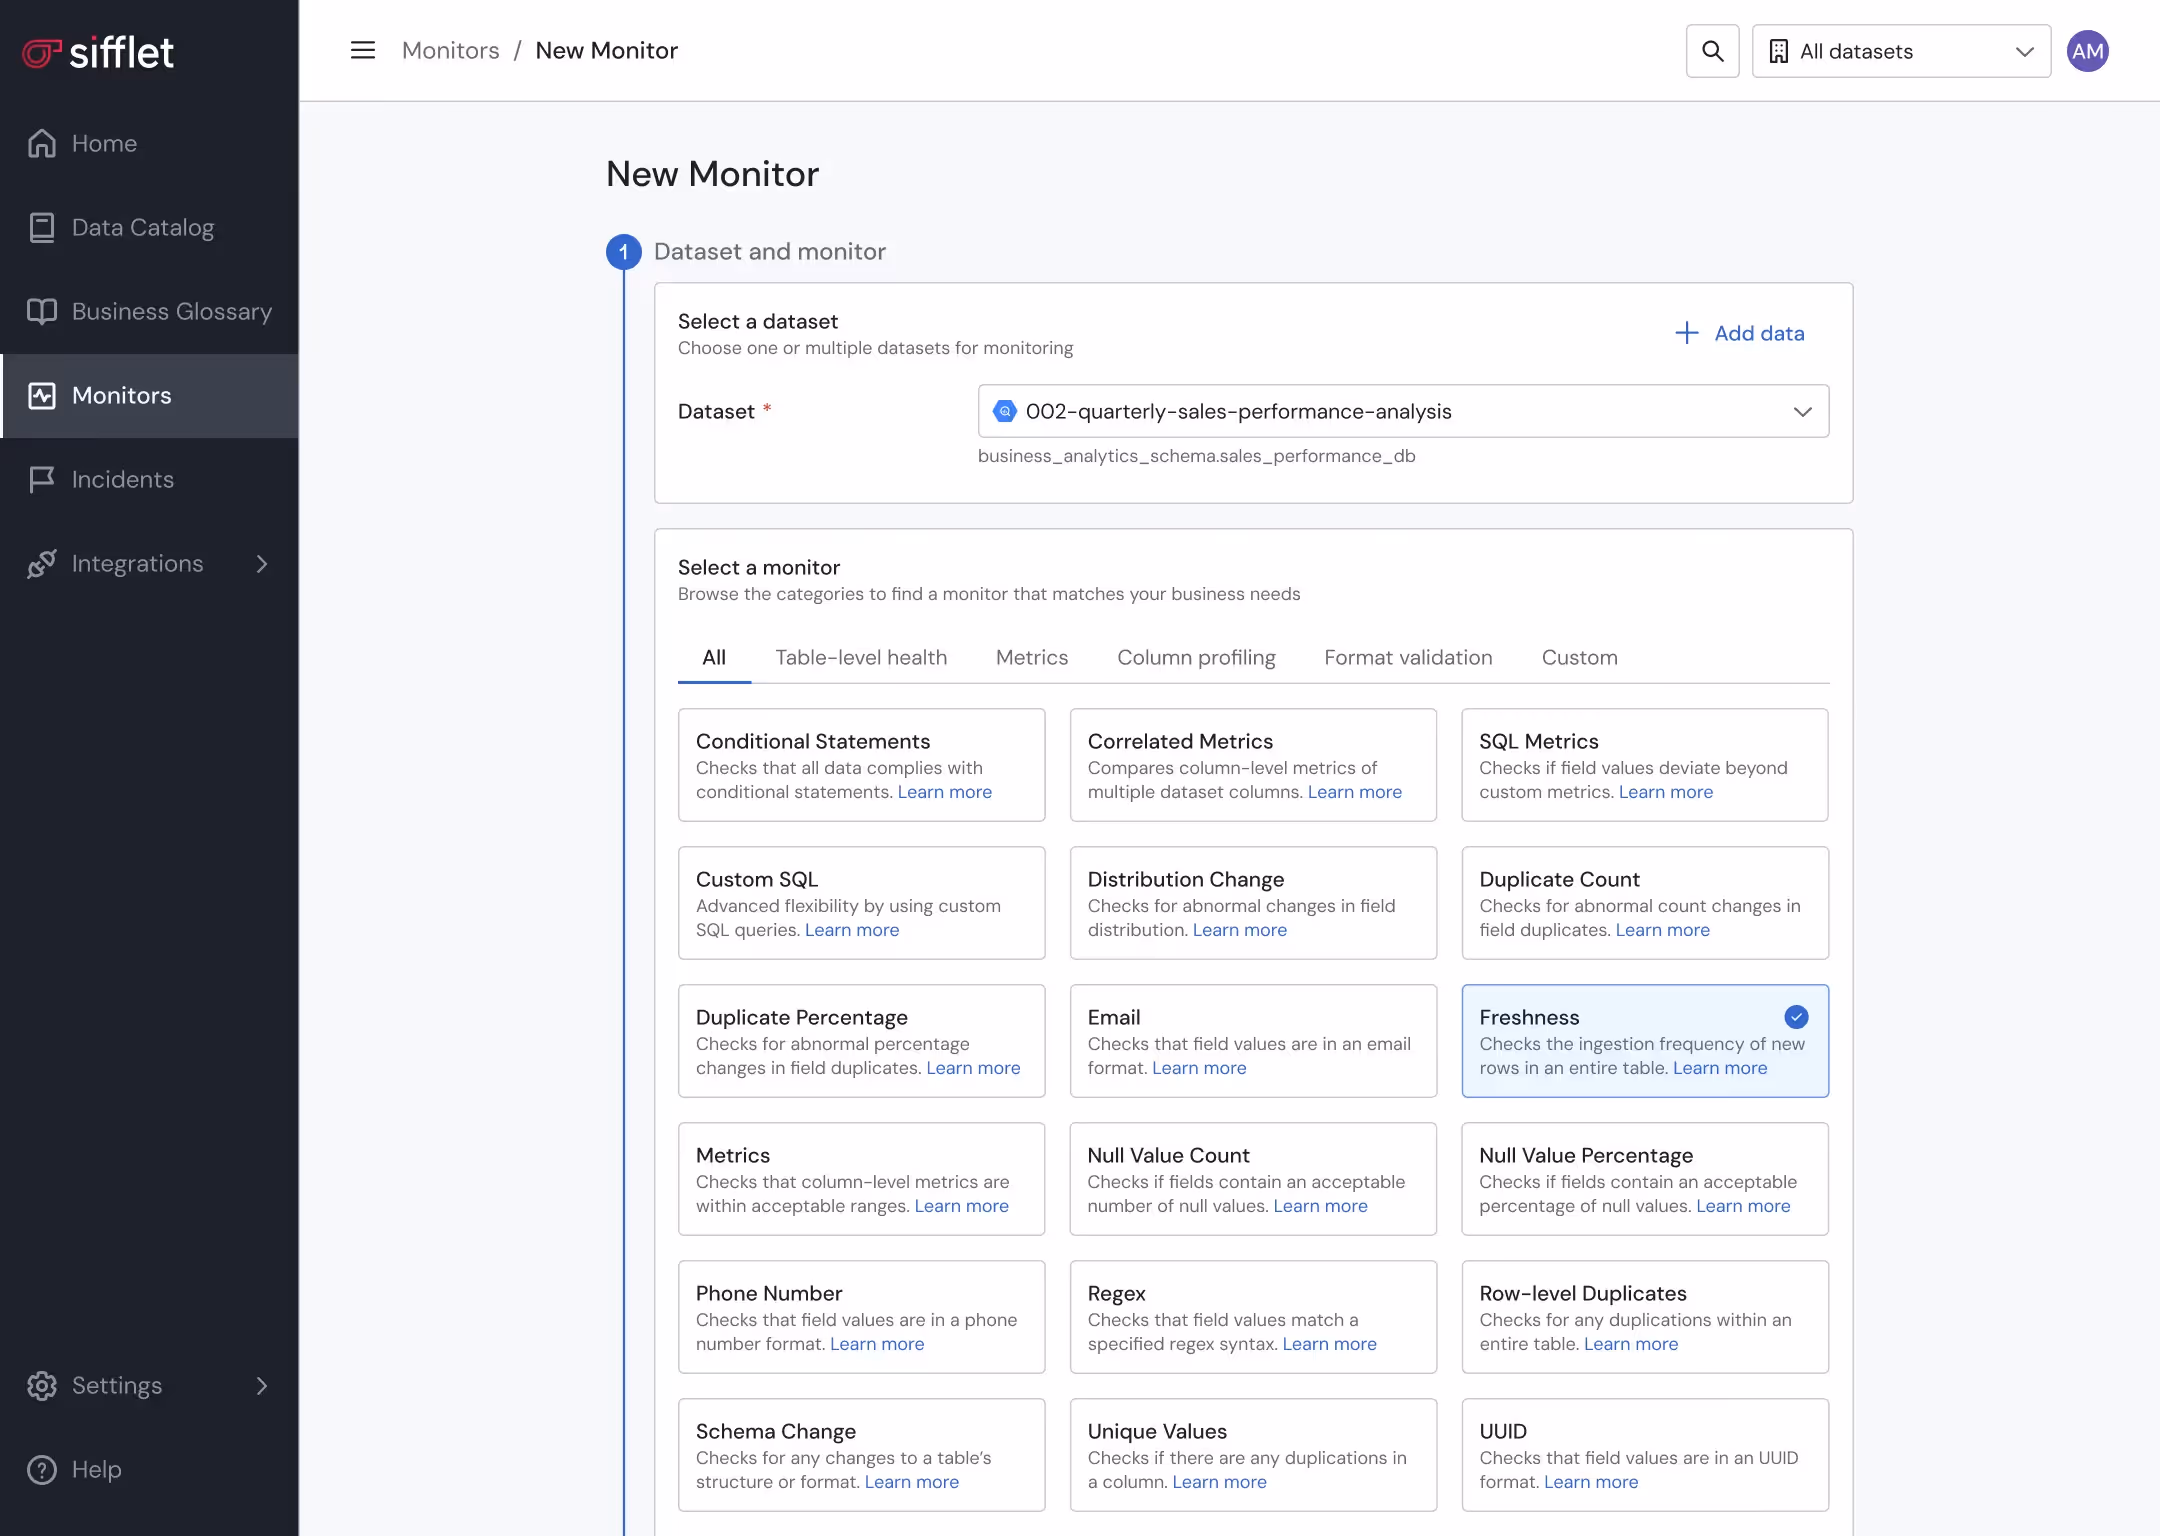
- Ensure proactive data quality thanks to a large library of OOTB monitors and a built-in notification system
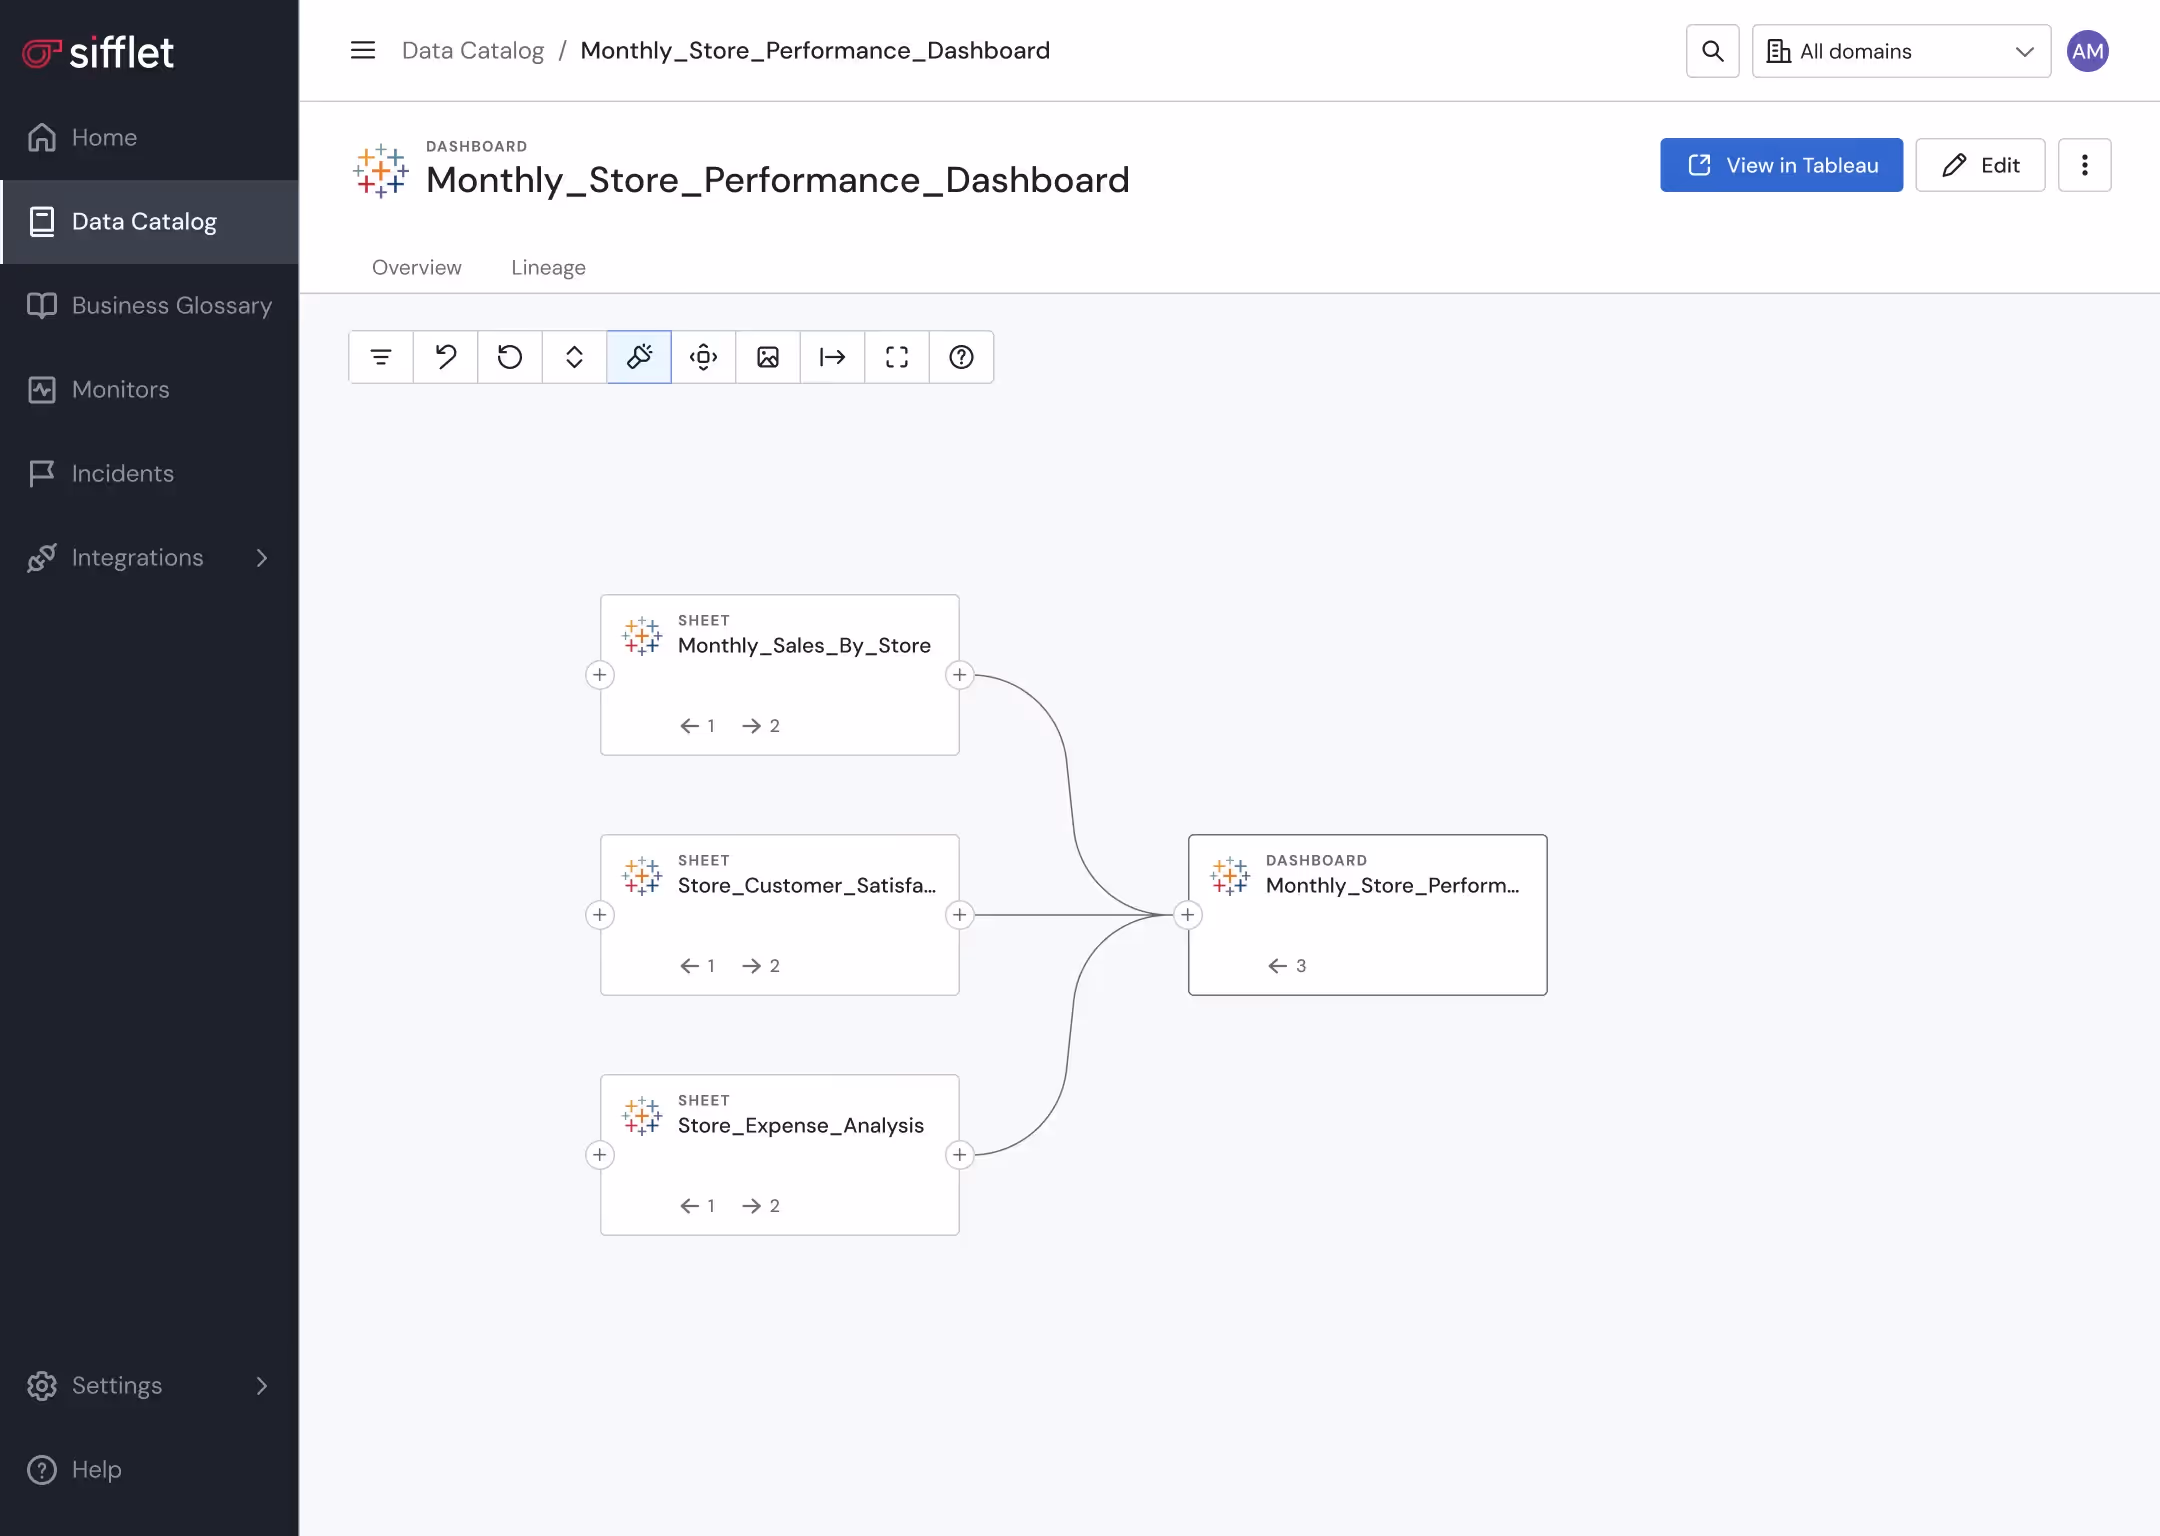
- Gain visibility over assets’ documentation and health status on the Data Catalog for safe data discovery
- Establish the official source of truth for key business concepts using the Business Glossary
- Leverage custom tagging to classify assets
Structured data observability platform
- Tailor data visibility for teams by grouping assets in domains that align with the company’s structure
- Define data ownership to improve accountability and smooth collaboration across teams
Secured data management
Safeguard PII data securely through ML-based PII detection
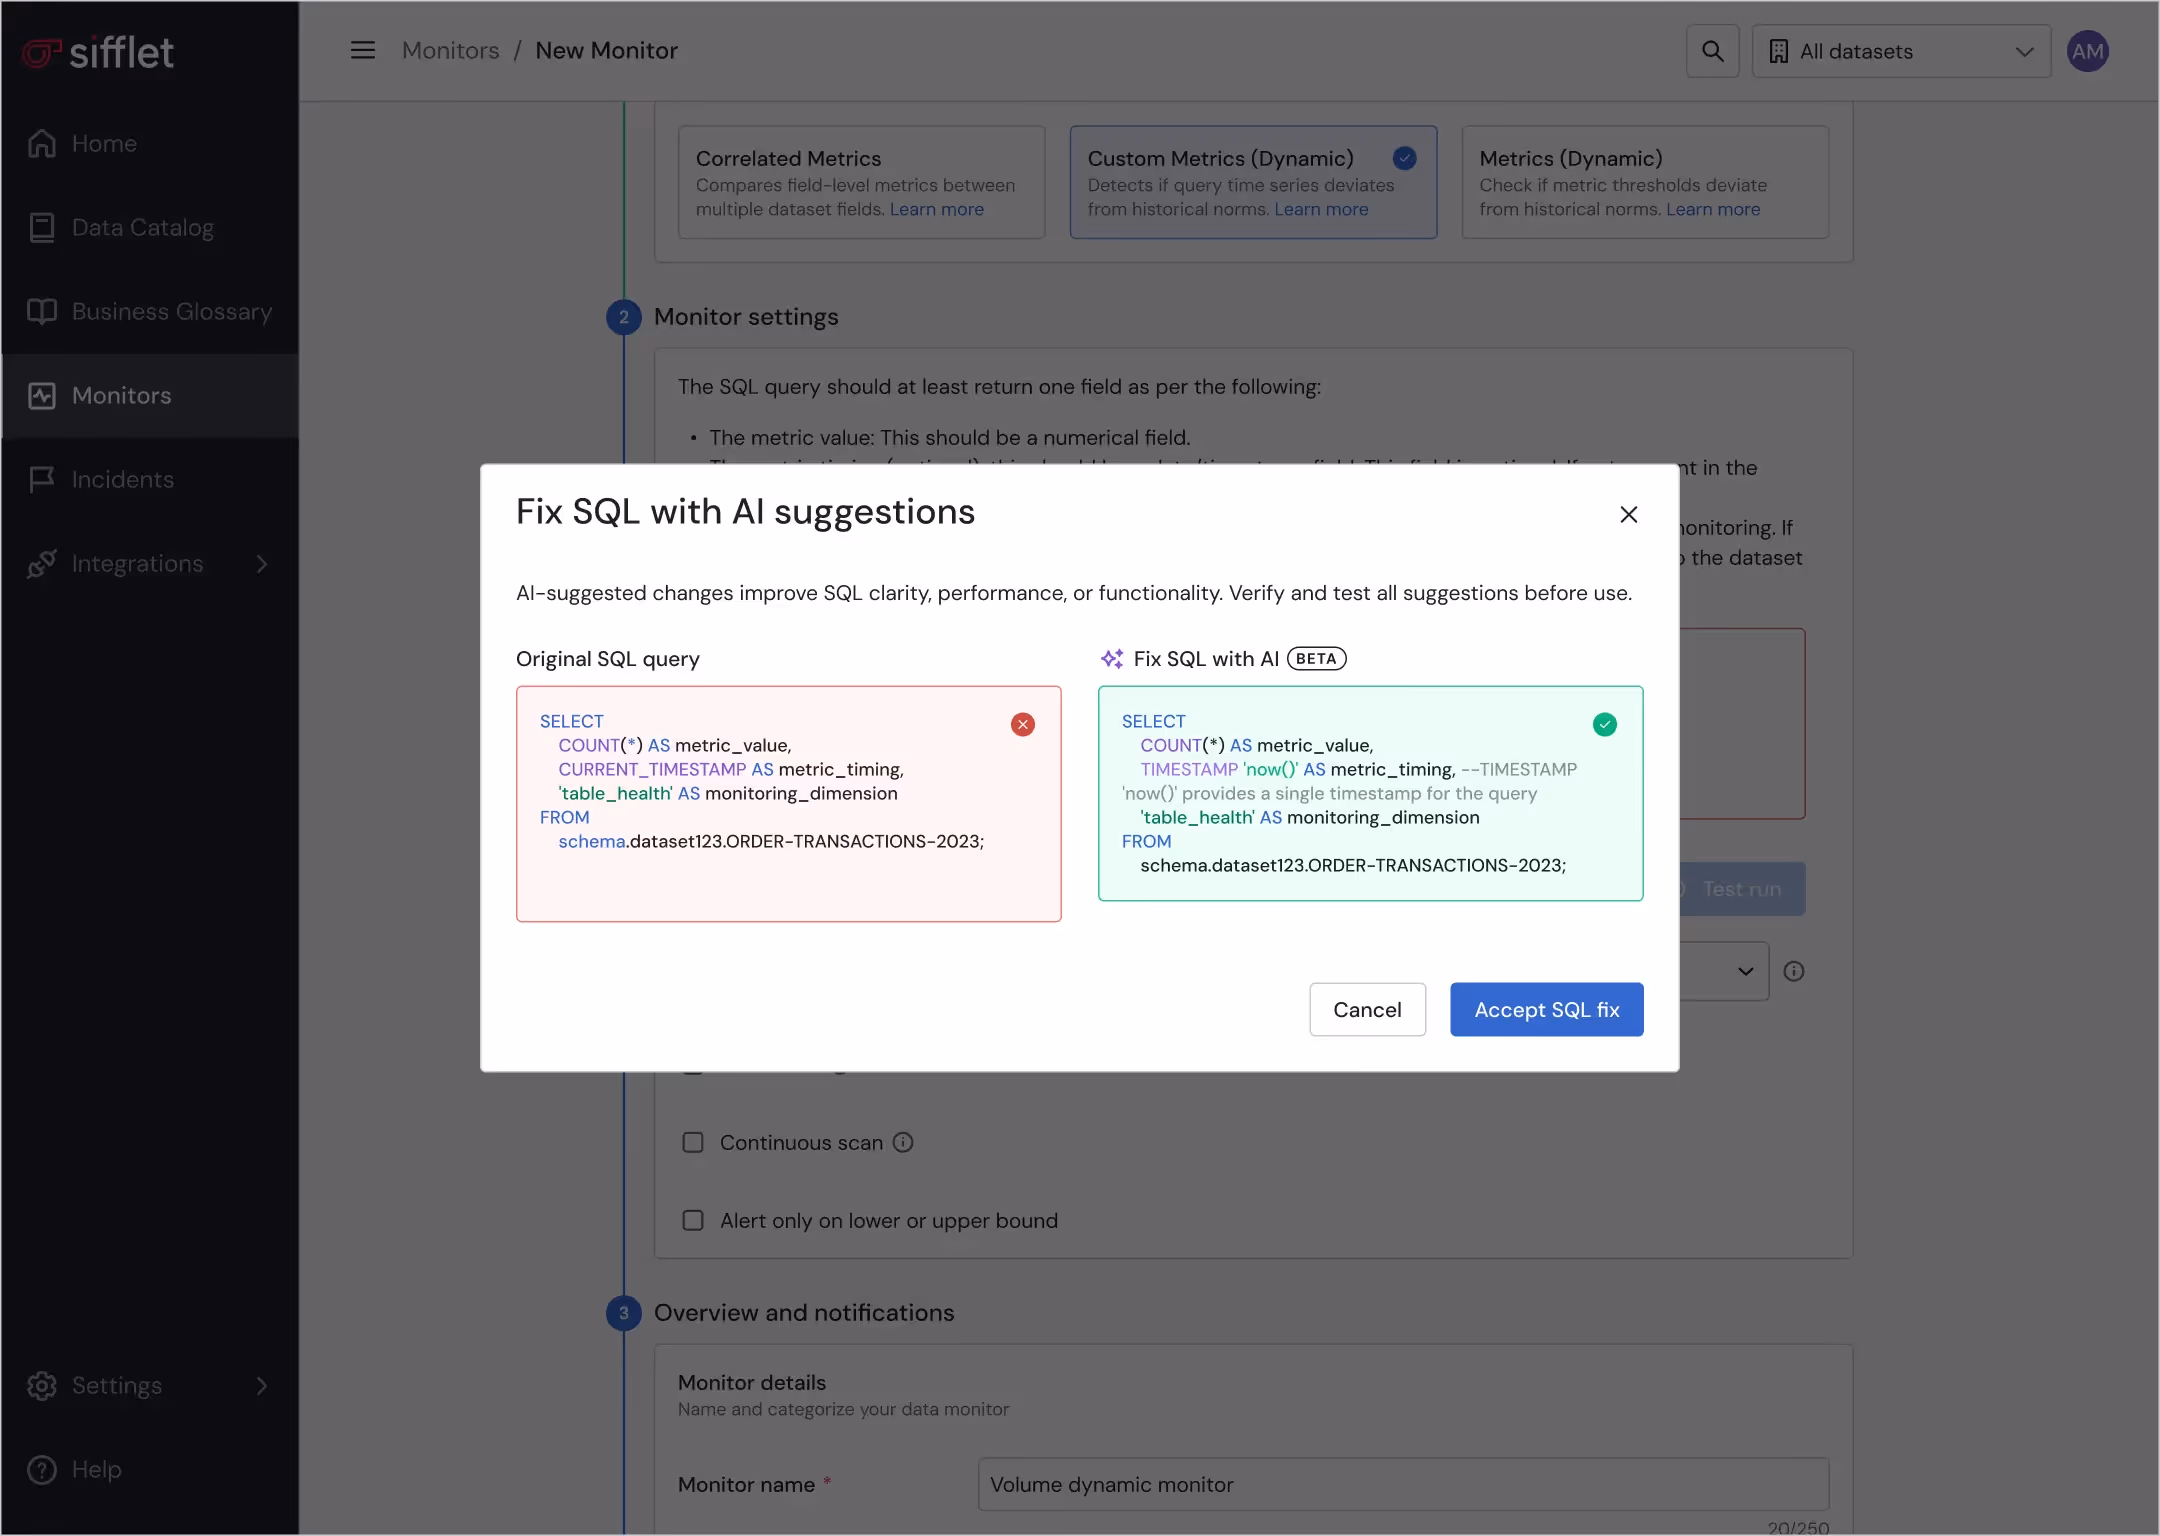
Sifflet’s AI Helps Us Focus on What Moves the Business
What impressed us most about Sifflet’s AI-native approach is how seamlessly it adapts to our data landscape — without needing constant tuning. The system learns patterns across our workflows and flags what matters, not just what’s noisy. It’s made our team faster and more focused, especially as we scale analytics across the business.


"Enabler of Cross Platform Data Storytelling"
"Sifflet has been a game-changer for our organization, providing full visibility of data lineage across multiple repositories and platforms. The ability to connect to various data sources ensures observability regardless of the platform, and the clean, intuitive UI makes setup effortless, even when uploading dbt manifest files via the API. Their documentation is concise and easy to follow, and their team's communication has been outstanding—quickly addressing issues, keeping us informed, and incorporating feedback. "

"Building Harmony Between Data and Business With Sifflet"
"Sifflet serves as our key enabler in fostering a harmonious relationship with business teams. By proactively identifying and addressing potential issues before they escalate, we can shift the focus of our interactions from troubleshooting to driving meaningful value. This approach not only enhances collaboration but also ensures that our efforts are aligned with creating impactful outcomes for the organization."

" Sifflet empowers our teams through Centralized Data Visibility"
"Having the visibility of our DBT transformations combined with full end-to-end data lineage in one central place in Sifflet is so powerful for giving our data teams confidence in our data, helping to diagnose data quality issues and unlocking an effective data mesh for us at BBC Studios"

"Sifflet allows us to find and trust our data"
"Sifflet has transformed our data observability management at Carrefour Links. Thanks to Sifflet's proactive monitoring, we can identify and resolve potential issues before they impact our operations. Additionally, the simplified access to data enables our teams to collaborate more effectively."

"A core component of our data strategy and transformation"
"Using Sifflet has helped us move much more quickly because we no longer experience the pain of constantly going back and fixing issues two, three, or four times."

Discover more title goes here
Frequently asked questions


-p-500.png)
