

The short answer
We describe Sifflet as the control plane for data and AI. In practice, that means one layer sitting across your warehouse, your transformation and orchestration tools, your BI (Business Intelligence) dashboards, and the AI systems your data feeds, instead of a separate check inside each one. It watches the health of your data as it moves through your stack, explains why something broke when it does, and shows who and what is affected.
Why "Sifflet"? It's French for whistle, the thing you blow when something goes wrong. Fitting, right?
What Sifflet actually does
Let’s explain this with an example -
A sales lead queries their revenue agent on Monday morning, and promptly jumps out of their seat at the AI telling them that daily revenue is down 30%. Nobody on the team knows what the cause might be - a pricing bug? A payment gateway outage?
After a lot of stress and hours of analysis, it turned out to be a case of bad data. Everything was fine on the ground. The revenue agent’s dataset received only half the records of Sunday’s sales, causing the ‘drop’ in revenue.
This is one example, but issues like this affect every team and company, and often lead to real loss of business because of misguided decisions made on bad data.
So what does Sifflet do for cases like this one?
1. Catches data issues, whether visible or invisible
In this scenario, everything worked as expected from a technical standpoint. Data kept flowing, and since nothing ‘broke’, no alert went off. These issues stay invisible until a business user questions a number in a report, or an AI agent confidently acts on an incorrect data point.
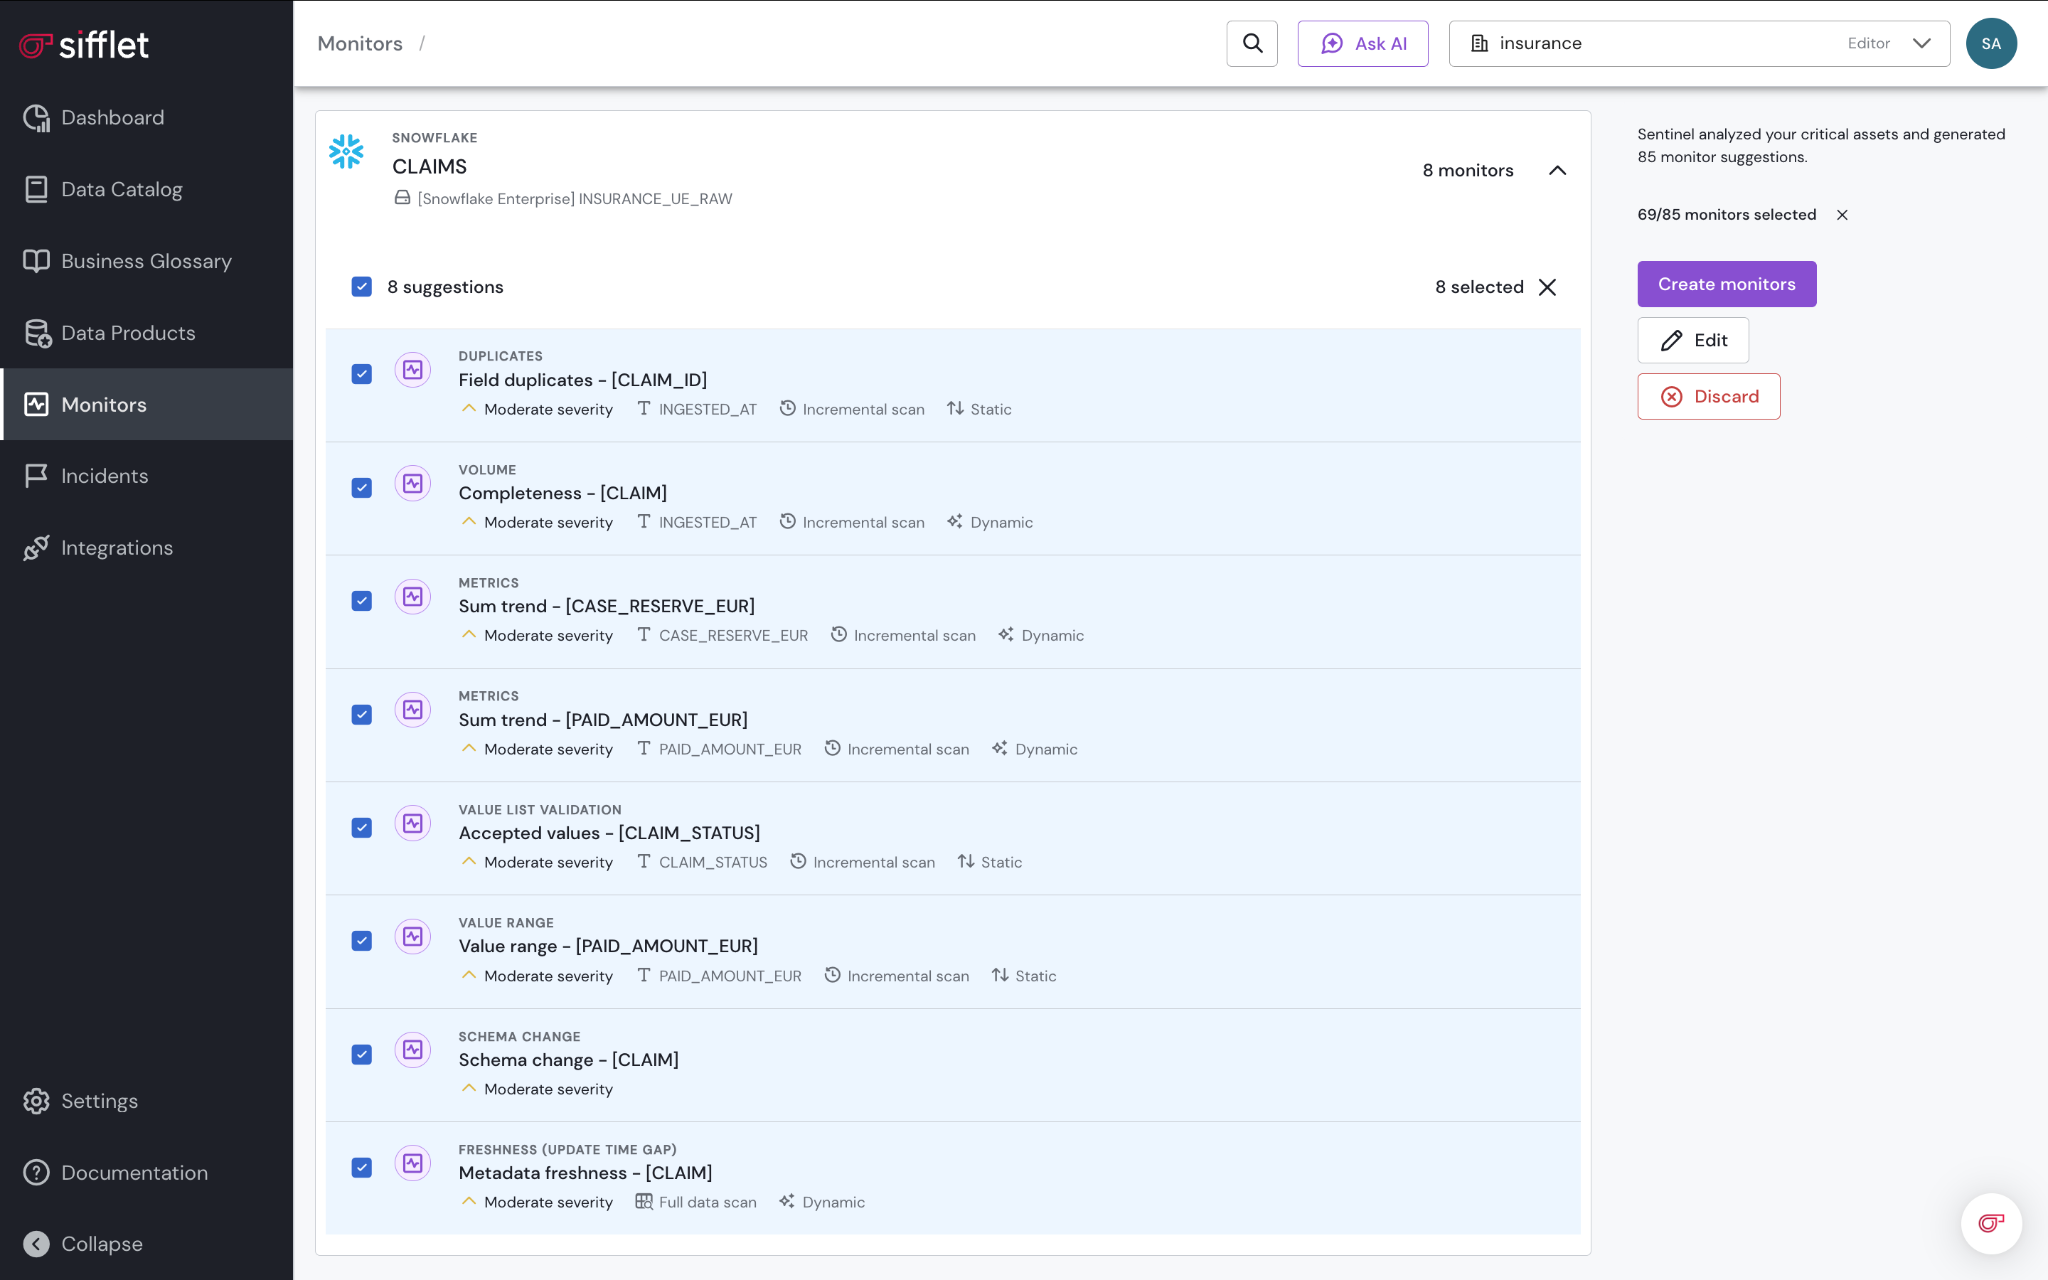
Sifflet catches these issues with monitors: rules that watch your data’s quality and behaviour and alert you when something breaks them. To get started fast, Sifflet’s Sentinel AI agent analyses your assets and suggests ready-to-use monitors, each with an explanation. You review the suggestions and create the ones you want in a few clicks.
In practice, establishing data quality checks often lags behind the pace of creating new pipelines. To combat this, Sifflet also allows monitors to be defined as code and shipped through CI/CD (Continuous Integration/Continuous Deployment) alongside the pipelines they protect. So data quality guidelines are deployed consistently and keep pace as the data estate grows.
2. Speeds up issue analysis and resolution with useful context
In modern data stacks with a jumble of sources, pipelines and consumers, tracing the root cause of a data issue is akin to finding a needle in a haystack. Data engineers have to log into each tool, comb through alerts or logs to understand context, and then piece together the clues to identify the root cause before they can devise and deploy a fix. At each step, they get bombarded with additional alerts because each tool sounds its own alarm as the issue propagates through a pipeline.
Sifflet cuts through the noise by keeping an eye across the stack and acting as your data detective.
It connects to your tools, and creates a comprehensive map of how data flows from source to destination, down to individual fields. This is called lineage. For each data issue, lineage shows what's upstream (the likely cause) and what's downstream (who's about to be affected). Troubleshooting becomes painless as teams have a literal map of the issue, from cause to effect.
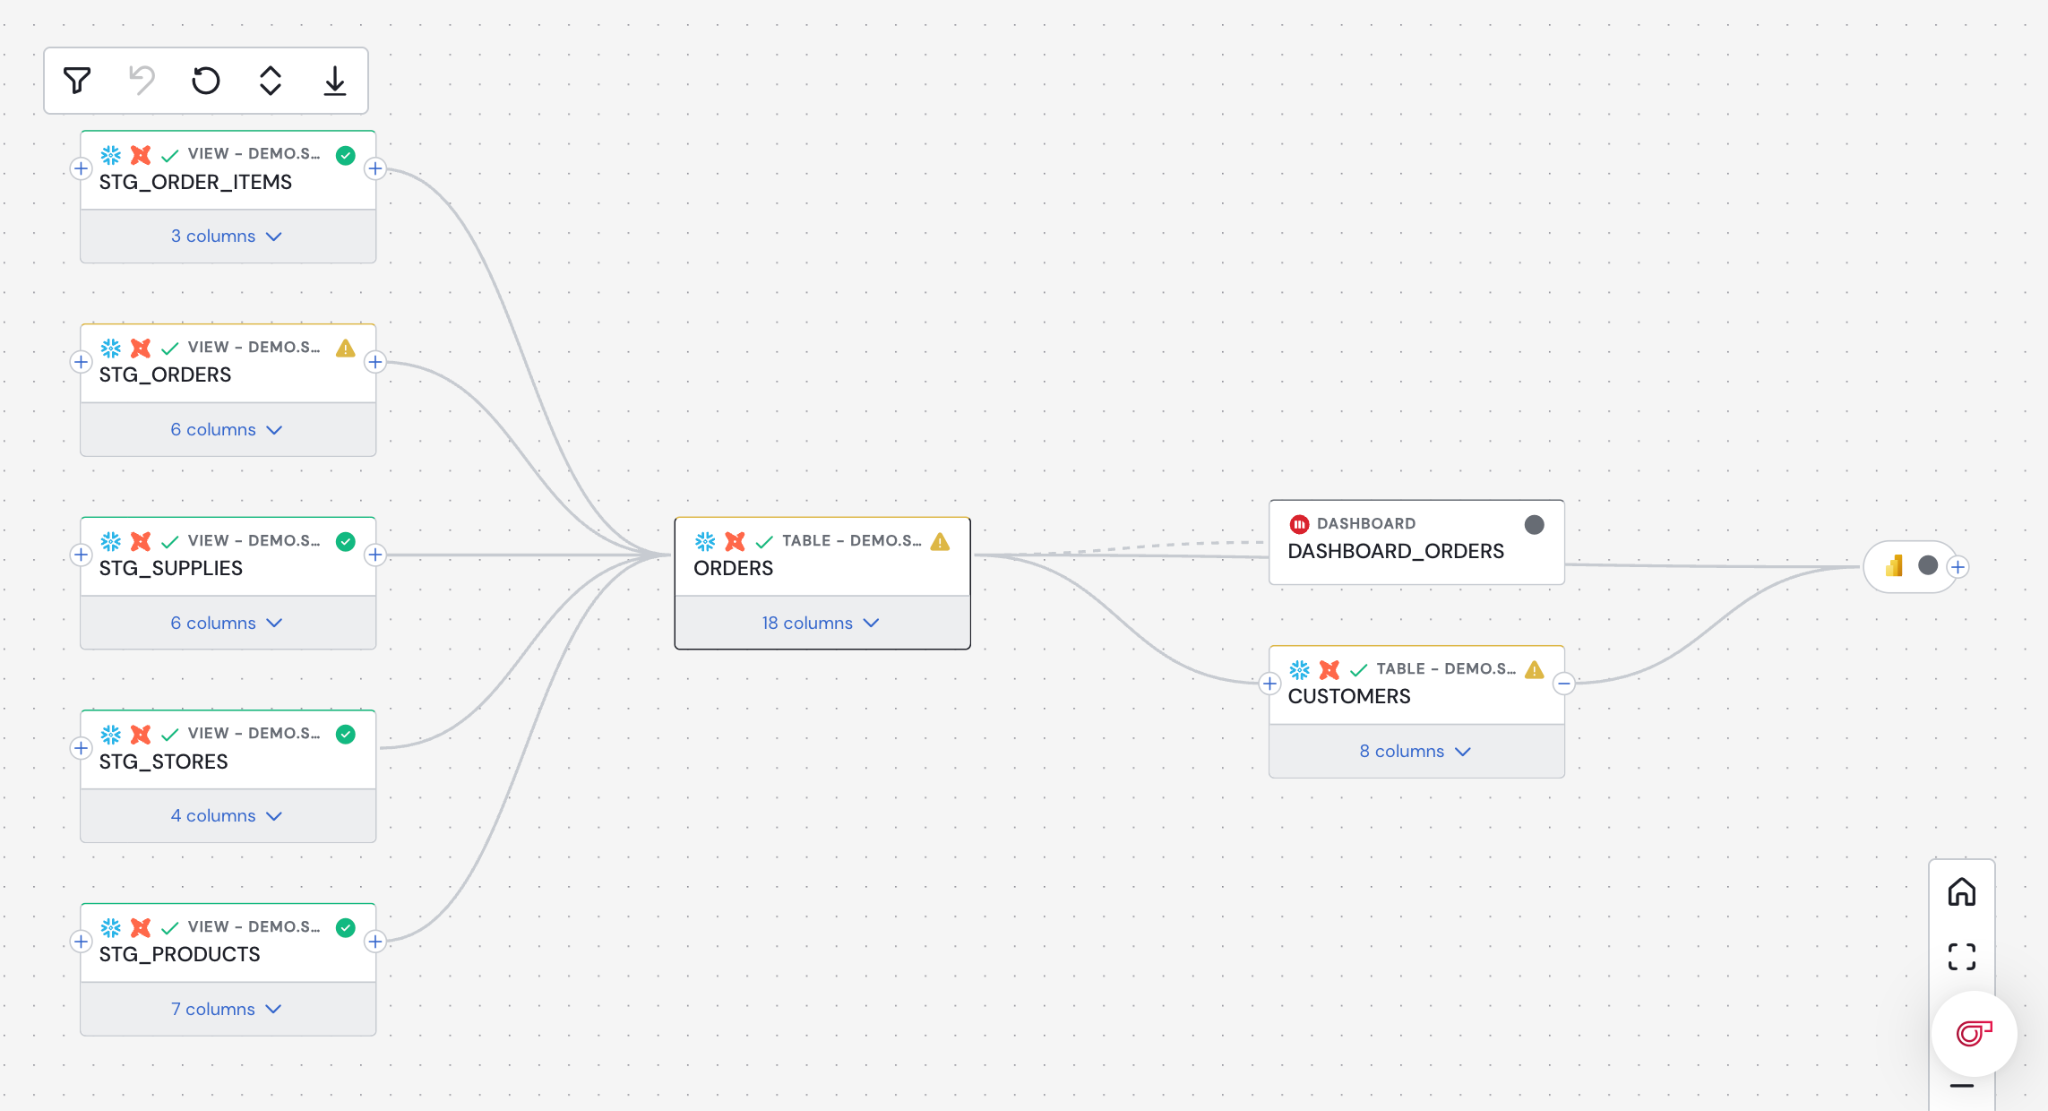
Incident resolution gets faster too. When monitors fail, Sifflet groups related failures into a single incident, along with lineage, impacted dashboards and the history of what happened. With the Sage AI agent turned on, Sifflet also writes a plain-language summary and a likely root cause. Notifications go to the right team in Slack, Teams or email. Jira or ServiceNow tickets can be created automatically when a monitor fails, or with one click from the incident.
3. Establishes data trust, and keeps governance intact at scale
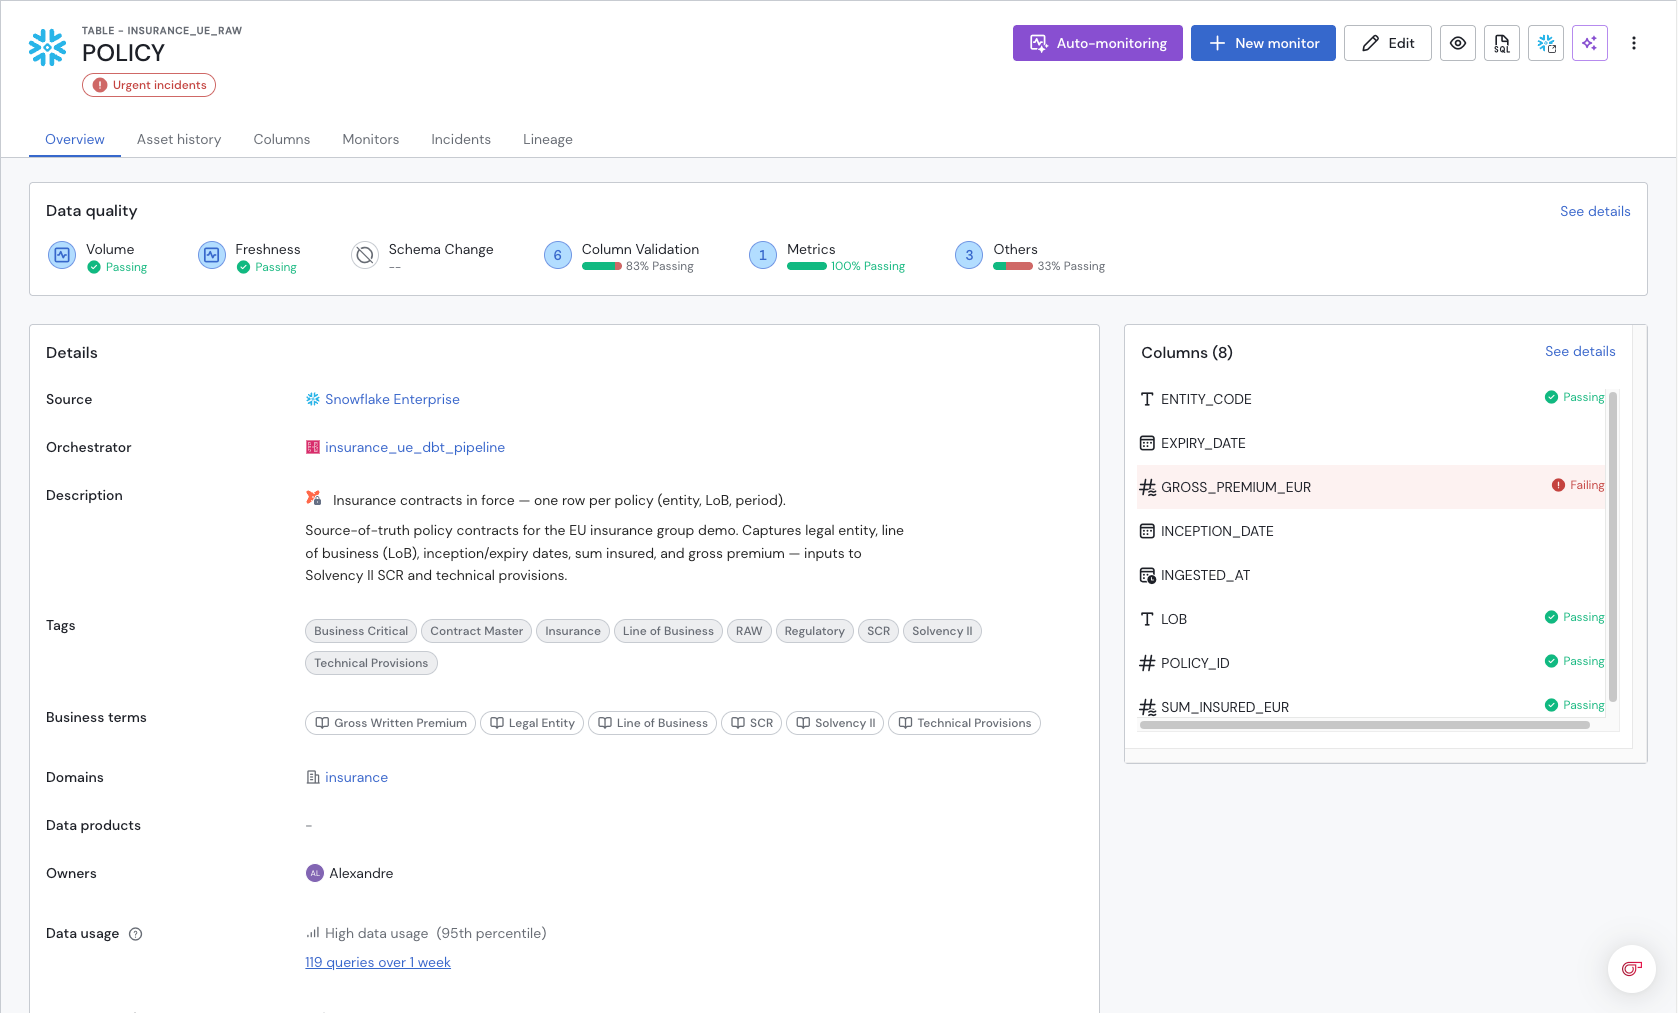
As companies rush to leverage AI, it’s hard to overstate the importance of a clean, trustworthy data foundation. Sifflet establishes data trust through a searchable inventory of your data assets with owners, descriptions, and their current health. People can find the right table and see whether it's safe to build on that data today.
On the other hand, people reading that data also need to be informed about its reliability. The Sifflet Insights browser extension surfaces upstream issues directly inside BI tools such as Tableau, Looker, and Power BI, so no one makes decisions on questionable data.
Finally, governance teams get a bird’s-eye view of their data estate’s health. Dashboards show incidents, failing monitors and impacted assets across the estate. The Operations Dashboard, currently in beta, also flags heavily used assets that have no monitor yet.
So what sets it apart?
Sifflet often gets categorized as a 'data observability' platform. While it's not an unfair comparison, it does gloss over some of Sifflet's biggest differentiators.
- Business context over technical metrics
Traditional tools treat every table equally and focus on technical failures. Sifflet ties anomalies to business impact, such as the dashboards that depend on the affected data, how heavily an asset is used, and who owns it. Teams can then focus on what matters most.
- Metadata-only processing and privacy by design
Instead of scanning raw data, Sifflet operates on a metadata-first architecture. Sifflet works with read-only access and, by default, doesn’t store your raw data. Its AI agents work on metadata only.
- Cross-stack lineage and control
Sifflet connects ingestion, transformation, orchestration and BI in a single control plane. Lineage runs end to end, down to field level in supported warehouses, so teams can trace root causes and assess downstream impact in one view.
Where it plugs in
Sifflet connects to the tools most data teams already use, and runs on AWS, Google Cloud, and Microsoft Azure.
- Warehouses and lakehouses: Snowflake, Databricks, BigQuery, Amazon Redshift
- Pipelines and transformation: dbt, Apache Airflow, Fivetran
- BI tools: Tableau, Power BI, Looker, Qlik
- Alerts and tickets: Slack, Microsoft Teams, Jira, ServiceNow and custom alerting through emails and webhooks
What it means for you
If you're a data consumer
You don't need to run a data platform to get the core idea: data can be wrong without anything crashing. Sifflet is a smoke detector for data fires. It sounds before the bad number reaches a decision or a model.
If you're a data analyst
You're usually the first person asked "is this number right?" and the last to find out it wasn't. With Sifflet, you can check an asset's health before building on it, and see upstream issues from inside your dashboard. No filing tickets and no waiting.
If you're a data engineer
Less detective work. Instead of a generic "row count anomaly" alert, you get the alert enriched with lineage, recent schema changes, and downstream impact. Business context means you can now tell a broken executive dashboard from harmless drift in a staging table, and triage accordingly. And with monitors as code, data quality lives in your repo and your CI/CD, not in a separate UI.
If you lead data governance
Lineage gives you an auditable record of where data comes from and where it goes, which matters for regulations such as GDPR (General Data Protection Regulation). Ownership and health live in one place, so policies are visible in daily work, not only in a document.
Longer term, the data Sifflet captures becomes a valuable source of truth for teams looking to improve the health and resilience of their data estate over time.
So you end up with fewer firefights, faster recovery, a clear path to improvement, and a clearer answer to the question executives and AI programs both ask: can we trust this?
What Sifflet is not
Being clear about boundaries helps you place it in your stack.
- Not a warehouse or a transformation tool. It observes your stack; it doesn't replace Snowflake or dbt.
- Not APM (Application Performance Monitoring). Tools like Datadog watch servers and apps. Sifflet watches the data those systems produce and consume.
- Not a substitute for data ownership. It routes issues to owners and makes them visible, but a team still has to fix them.
In short
Sifflet builds data trust. It catches data issues before the business does, shows what they affect, and explains why they happened, so the people and AI that depend on your data can trust it. It does this in one layer across your data stack, for everyone from the engineer fixing the pipeline to the leader signing off on the number.
How to get started
- Connect one warehouse. Start where your most important dashboards and models get their data.
- Let Sifflet map lineage and suggest monitors.
- Review recommended monitors and deploy a monitoring strategy for your most critical assets.
- Route alerts to where your team already works, such as Slack, Teams, or Jira, and install Sifflet Insights for your dashboard users.
- Pick one high-stakes asset, a board-level dashboard or a production AI use case, and trace its health end to end. That's your proof point.
You can start a free trial or read the technical docs.