


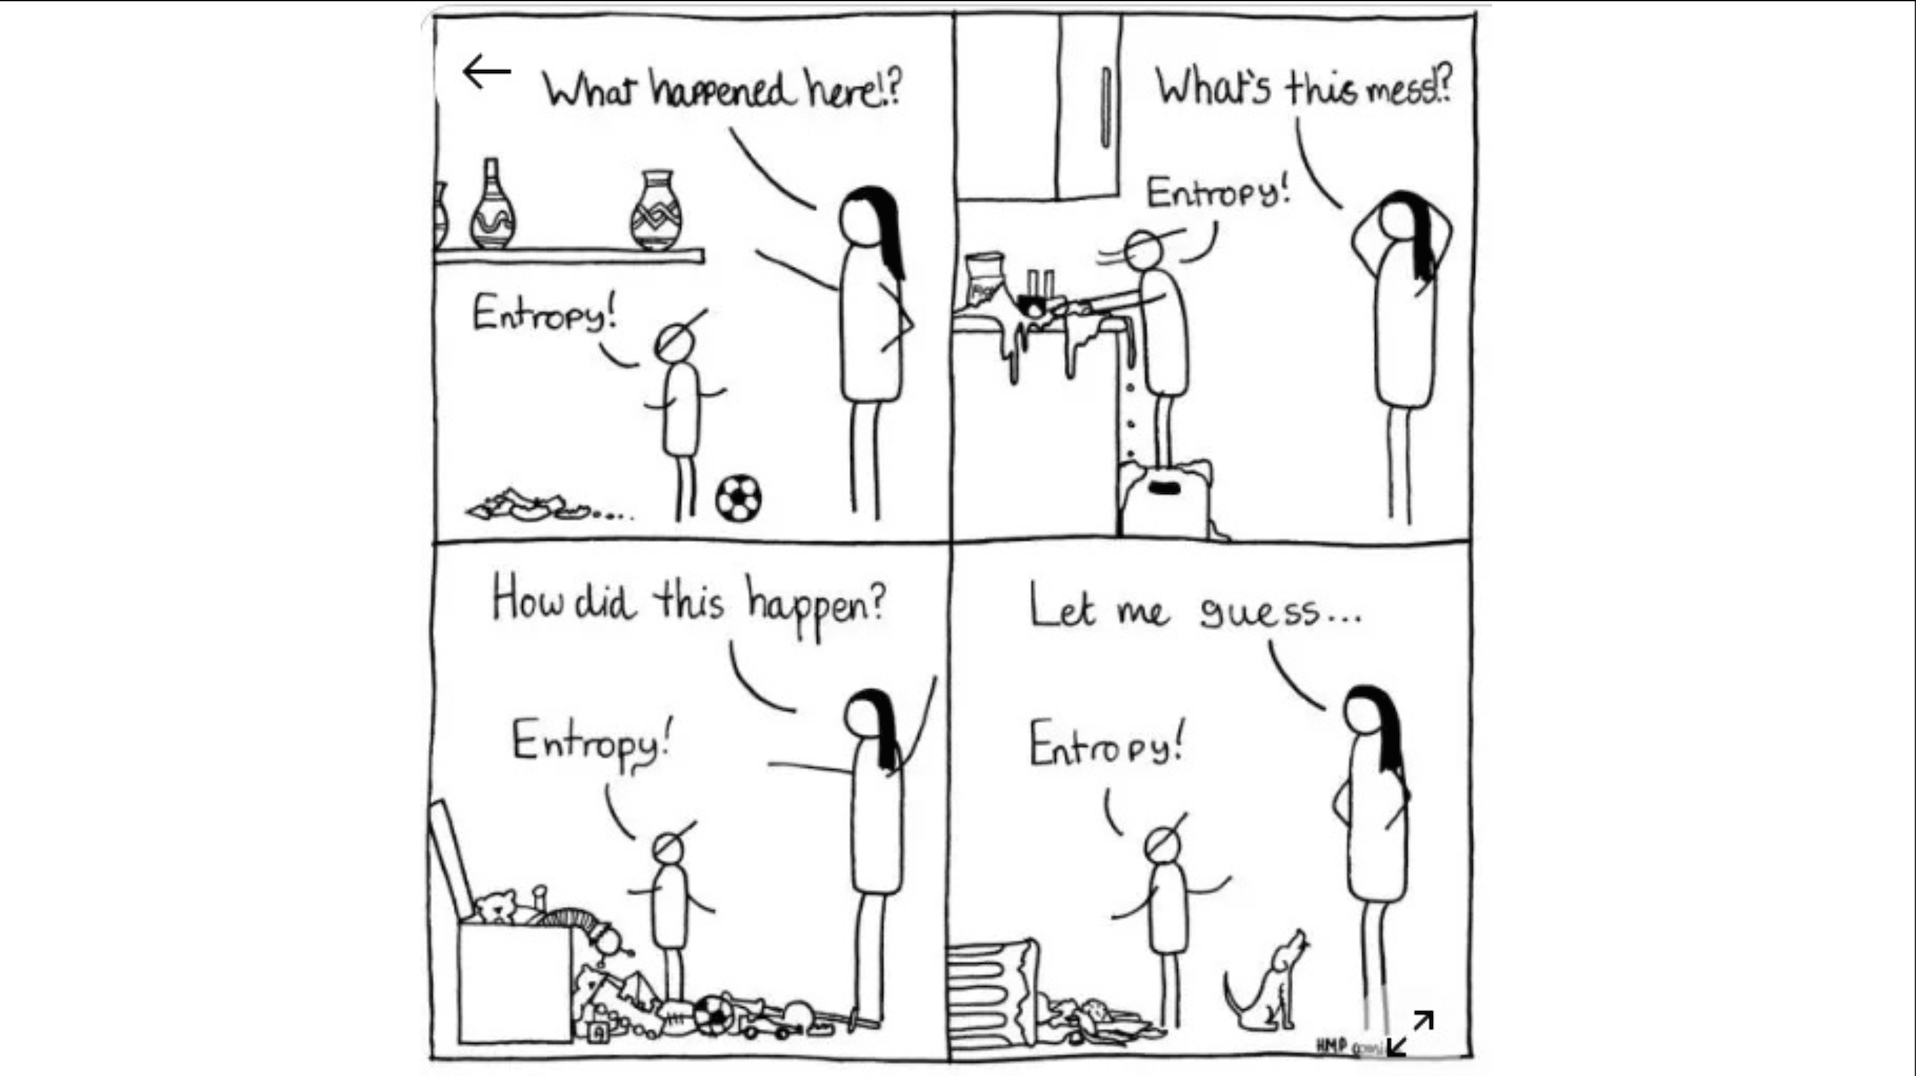
In March 2022, I started a newsletter called Data Entropy. A year later, I wrote a longer essay about it. The argument was simple. Data platforms obey their own version of the second law of thermodynamics. Disorder accumulates. Every pipeline you add, every tool you connect, every transformation you ship increases the number of places where meaning can change. Left alone, entropy in a data platform only grows.
The term borrowed from two places on purpose.In thermodynamics, entropy measures how many ways a system can be disordered. The second law says it always increases in an isolated system, and you can only reduce it locally by spending energy and pushing the disorder somewhere else. In information theory, Shannon defined entropy as the uncertainty about a system’s state, the amount of information you are missing.
Both readings apply to data platforms, but the second is the one data teams experience every day. When you look at a number and cannot say whether it is fresh, whether its definition changed last week, or whether the join behind it still behaves the way it did at design time, you are experiencing information entropy. The number is there. The knowledge about its state is not.
In 2022, that was mostly an efficiency problem. Teams drowned in troubleshooting. Stakeholders questioned dashboards. Data engineers burned out reconciling numbers that should have matched. Expensive, frustrating, and ultimately manageable, because the final consumer in the chain was almost always a human. A human notices when something looks wrong. They ask questions. They delay the decision. The blast radius of entropy was usually a bad meeting.
What changed
Everything changed, on both sides of the gap.
Start with the platform itself, because the stack I described in 2022 no longer exists.
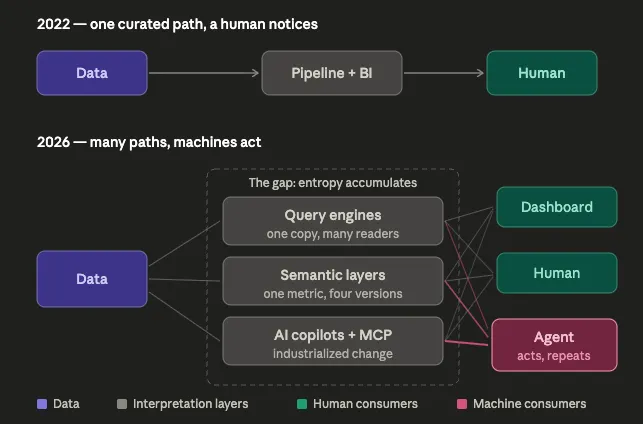
Open table formats became the default. In fairness, they solved a real entropy problem. Before Iceberg and Delta, we copied data between systems, and physical copies drift apart. That was entropy in its crudest form, and one governed copy is genuinely better. But the disorder did not disappear. It moved up. One copy, many interpreters. Spark, Trino, Snowflake, DuckDB can all read the same table now, and each brings its own SQL semantics, its own type coercion, its own timezone behavior. Same table, same question, different answers depending on which engine you asked. The entropy left the storage layer and took up residence in the interpretation layer.
Semantic layers went the same way. In theory, a semantic layer kills entropy: define the metric once, use it everywhere. In practice, almost no one has a semantic layer. They have four, at a minimum, and none is doing the job. Revenue defined in dbt, re-declared in LookML, re-implemented in a Power BI dataset, and now re-modeled by whichever AI tool shipped its own semantic model this quarter. Every re-declaration is a place where a definition can drift. Re-declared definitions always drift.
And AI copilots dramatically accelerated how quickly teams write SQL, build pipelines, and ship changes.
Entropy is a function of change, and we industrialized change.
Then, on top of all that, the consumers and how they consume data changed.
The dashboard is under real pressure. Increasingly, business users ask questions in natural language and receive answers assembled on demand. A dashboard is a curated path to data, reviewed once and consumed many times. A generated answer is assembled each time from whatever the underlying layers currently believe to be true.
Protocols like MCP extend this further by giving assistants and agents a standard way to connect directly to data systems. Every platform is learning to serve machine consumers. The number of paths between data and a consequential answer has grown dramatically, and most of those paths did not exist when I wrote the original essay.
Data now feeds systems that act. Agents query metrics, compare options, trigger workflows, write to other systems, and make decisions continuously. Unlike humans, they do not have the right context to determine what is accurate and what is trustworthy. They consume what the interface presents and act on it.
Each of these developments is individually good. I would not roll back any of them. But they all have the same effect. They introduce more interfaces, more interpretation, more change, and more paths between data and decisions. Those are the raw ingredients of data entropy.
This changes the economics of entropy completely. The same undetected semantic shift that once produced a misleading dashboard can now produce an incorrect action. And while a human might encounter that mistake occasionally, an automated system can repeat it thousands of times before anyone notices. Entropy has not simply become more costly. It has become easier to amplify.
A revised definition
So the definition needs an update.
Data entropy is the disorder that accumulates between data and its consumers, human and machine.
The important word is between.
Entropy is not a property of a table or a pipeline in isolation. It exists in the gap between what the data actually is and what the consumer believes it is at the moment of consumption.
A perfectly maintained table queried through a stale semantic definition is high entropy. A messy table consumed with full knowledge of its limitations is comparatively low entropy.
The gap is the problem, and the gap is what has been growing.
Why it grew faster than the tools watching it
The last five years produced an entire industry dedicated to making data platforms more observable. Testing matured. Catalogs documented everything. Lineage became ubiquitous. I helped build part of that industry. But entropy kept growing anyway.
Partly because we kept adding to the stack faster than our ability to understand it. But there is also a deeper reason: Visibility and containment are different problems.
Knowing where entropy exists is a prerequisite. It is not the cure. Ironically, as more data infrastructure tools introduced their own flavor of observability and monitoring, more confusion arose. Saying that the data in this part of your (very complex) analytical or agentic workflow is accurate is useless information when the average enterprise uses 5–7 different data tools from multiple vendors, with 10% of teams juggling over ten separate platforms for a single project. That is, in fact, more entropy
The second law is specific on this point. Disorder decreases only where work is applied against it. And this is where I — as the founder of what was once called a Data Observability solution — can take accountability. Measuring entropy — which is what traditional Data Observability vendors do — is not going to help reduce it.
What this series will do
Over the coming weeks, I am going to take data entropy apart properly. Where it actually comes from, with a taxonomy you can use to audit your own platform. What it looks like in production, including incidents where every monitor stayed green and the answer was still wrong. Why today’s toolkit, including my own corner of it, has not contained it. And what containment actually requires now that the consumers increasingly include machines.
If you run a data platform that feeds anything automated, this series is for you.
The newsletter is back! Same problem, more complexity and higher stakes.













-p-500.png)
