


.avif)
As outlined in a previous article, the data cataloging market is nothing new. Metadata management solutions started seeing the light of day in the 90’s and a lot of companies are today equipped with some flavor of data cataloging.
Similarly, data quality testing is a practice that has been top of mind for data teams for as long as data was collected and relied upon to make business critical decisions.
More often than not though, companies would use if not two separate, then many more tools for data cataloging and data quality testing.
The paradigm we firmly believe in, here at Sifflet, is data observability “platformization”. What this means concretely is that we are convinced that there is value in bringing all these aspects of data management together into a unique platform, to reduce Data Entropy and remove the chaos.
This is the vision Sifflet was built upon: a full data stack integration suite for an automatically generated data creation and usage context (served through the data catalog) combined with a comprehensive data quality monitoring suite, for all data stakeholders.
In this post, we will walk you through Sifflet data cataloging and quality monitoring capabilities and we will highlight the benefits of using a unified platform for data discovery and quality testing.
Building your data ecosystem source of truth: The benefits of data cataloging and lineage
Sifflet integrates with technologies all across the Modern Data Stack and data pipelines. As soon as you connect Sifflet to your various technologies and trigger runs on your data sources, Sifflet starts collecting metadata and SQL logs to automatically generate or update your data catalog and lineage.
Elevate data discoverability with the data catalog
Once populated with data assets, Sifflet data catalog provides you with a breakdown of your data ecosystem through dimensions like asset types, technologies, usage or health.

You have the ability to leverage sidebar filters as well as the search bar to look for data assets you might be interested in. If you are a Data Analyst at an e-commerce company and are looking to perform an analysis on where website orders originate from, you can use the data catalog search bar to look for assets that contain the word “order” in their name or description. You can even tick the “Search on fields” checkbox to look for assets that feature this additional location information.
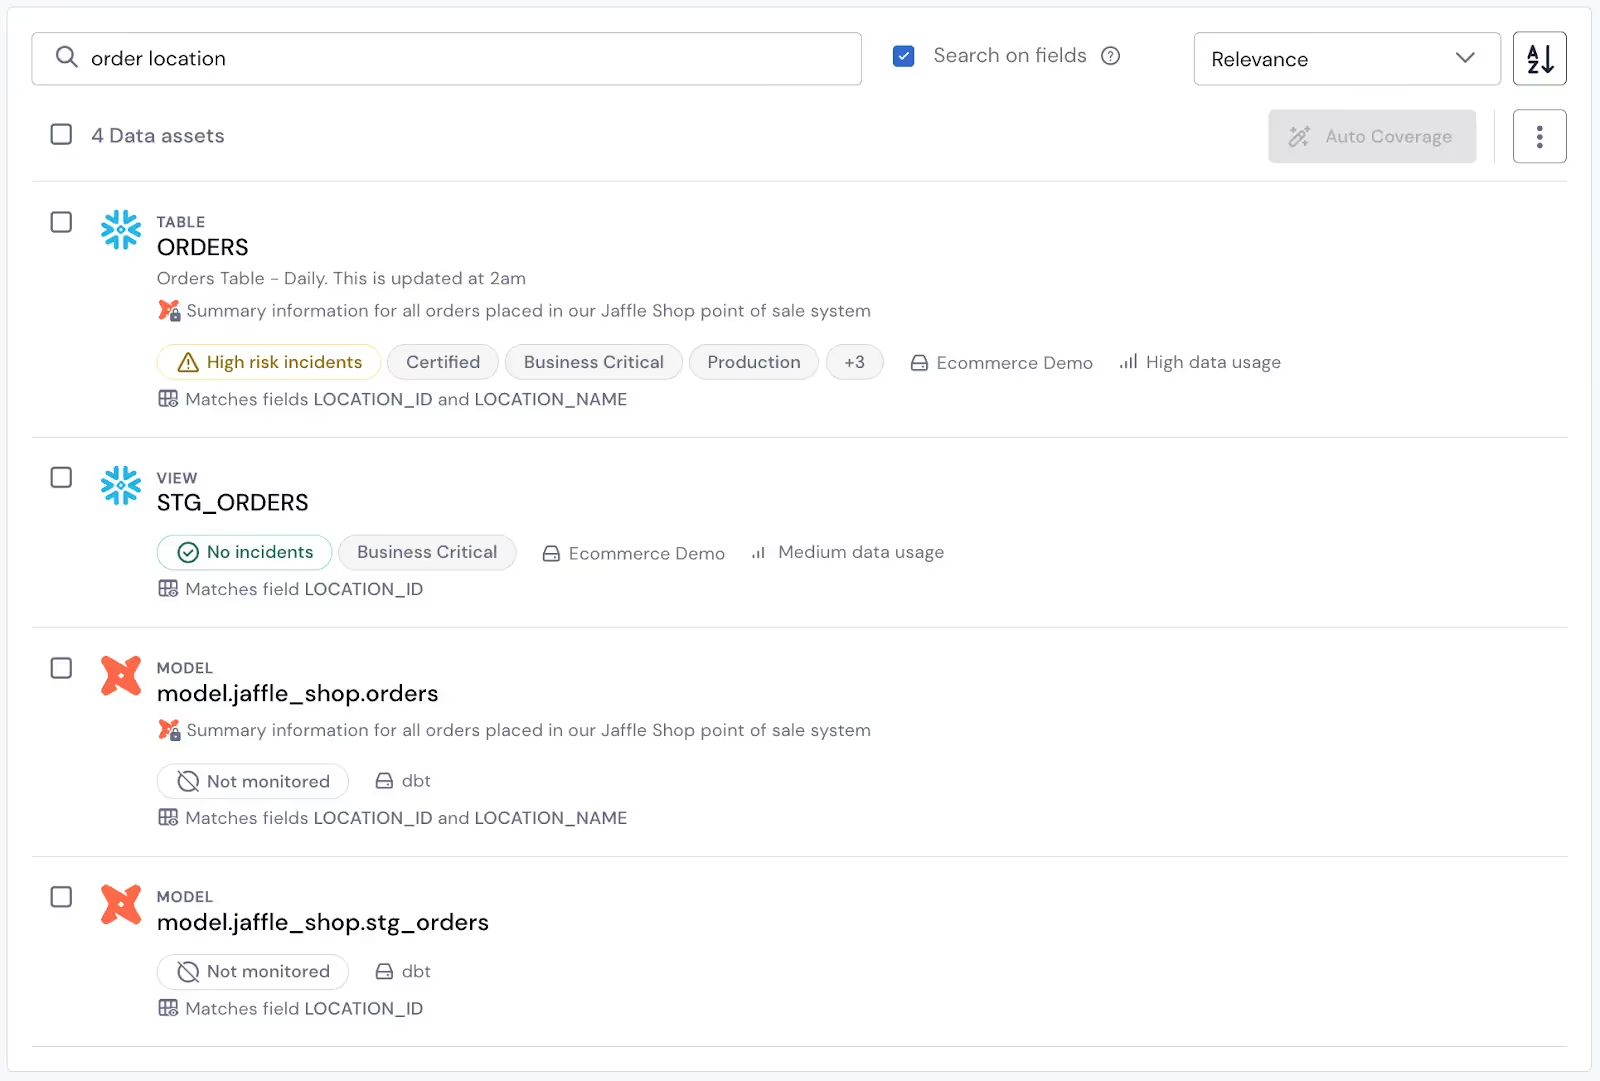
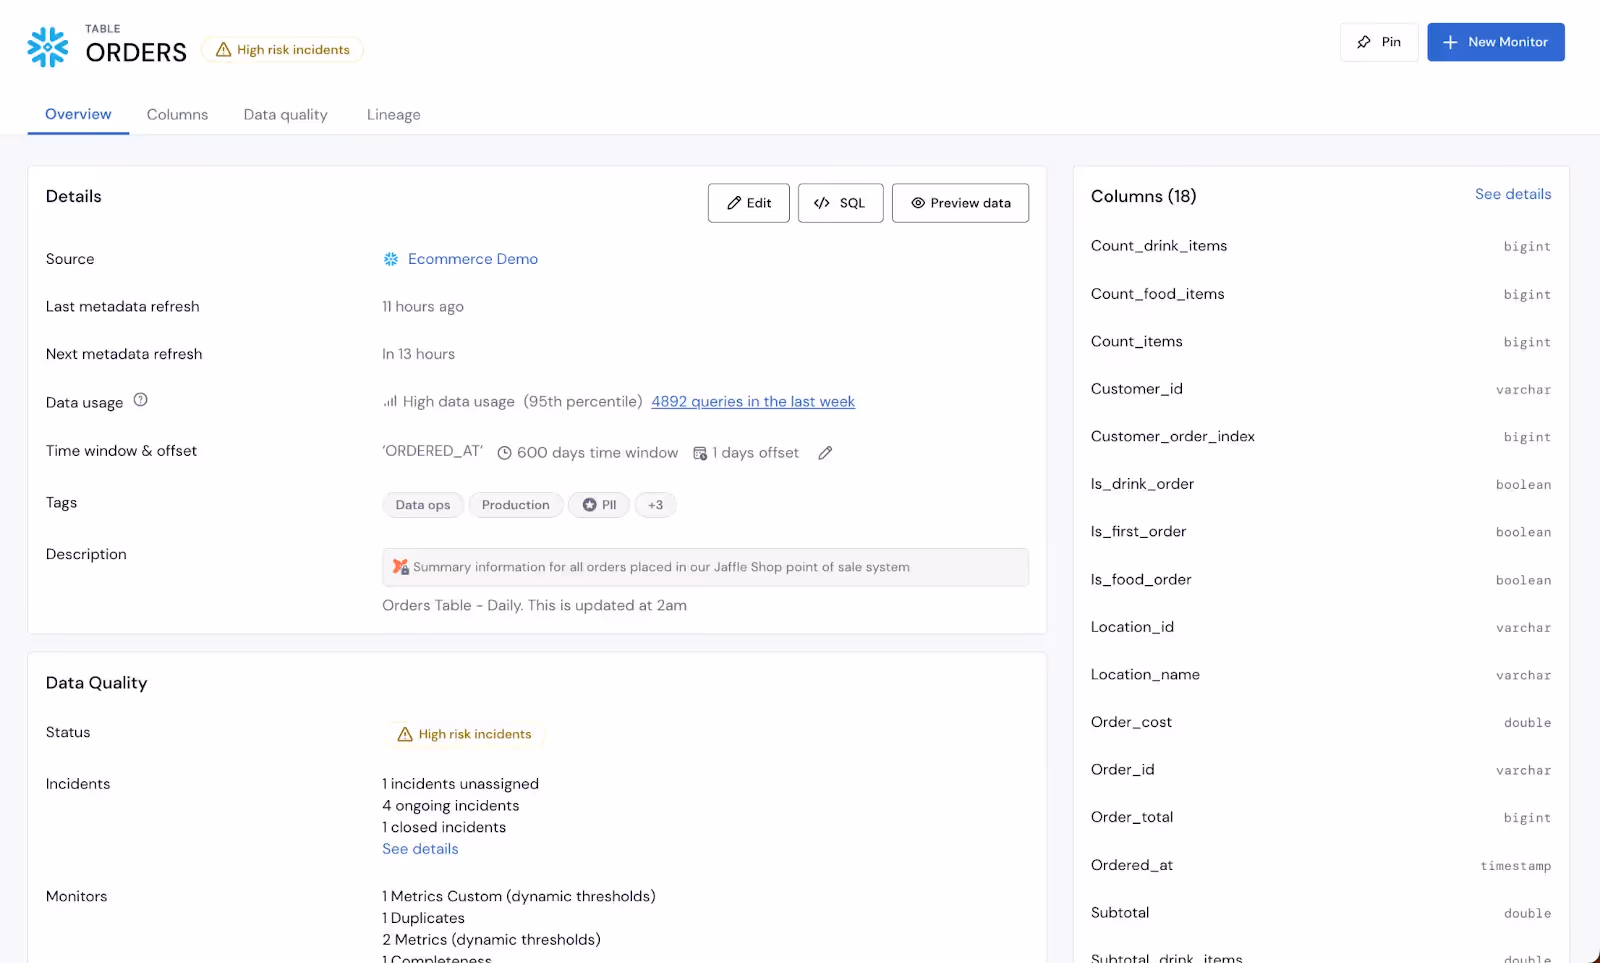
All assets are collected with context from their data source: Snowflake and BigQuery tables and views for instance show up in Sifflet with descriptions that might have been set directly at the data warehouse level or via dbt. Every table asset page also displays details about columns’ names, types, and descriptions as well as schema versions that were snapshotted by Sifflet over time.
This collected context can be enriched directly on Sifflet either manually or through machine learning based suggestions.
This level of context along with the ability to preview data, to visualize the level of the asset’s usage, and to check the asset’s SQL make the data catalog the source of truth for any user looking to find out more about their data assets.
Navigate your data lifecycle with lineage
Once configured and run, data sources also automatically generate lineage without requiring any manual work from your team. From the collection of the data to its visualization inside your BI tools, lineage provides your teams with a comprehensive yet visual way to understand the whole journey of data across your pipelines. This makes lineage a great onboarding tool for any new hires on your team.

Lineage is also extremely valuable to optimize time-to-resolution thanks to a simplified root cause analysis. If the marketing team reports an unexpected behavior on one of their Looker dashboards, data engineers can leverage lineage to quickly identify upstream assets that feed into this dashboard and that might correspond to where the reported issue originates from.
The other way around: lineage also allows teams to assess the business impact of their changes and consequently prevent them from pushing potentially breaking changes to production. As a data engineer looking to delete a specific table column, having a quick look at this column’s lineage allows you to quickly understand which downstream assets might get impacted by your change and ensure you communicate with the appropriate teams before actually deleting your column and breaking any existing dashboards.
The value of a solid monitoring suite: Detecting issues before they impact your teams
Stop issues before they impact your teams
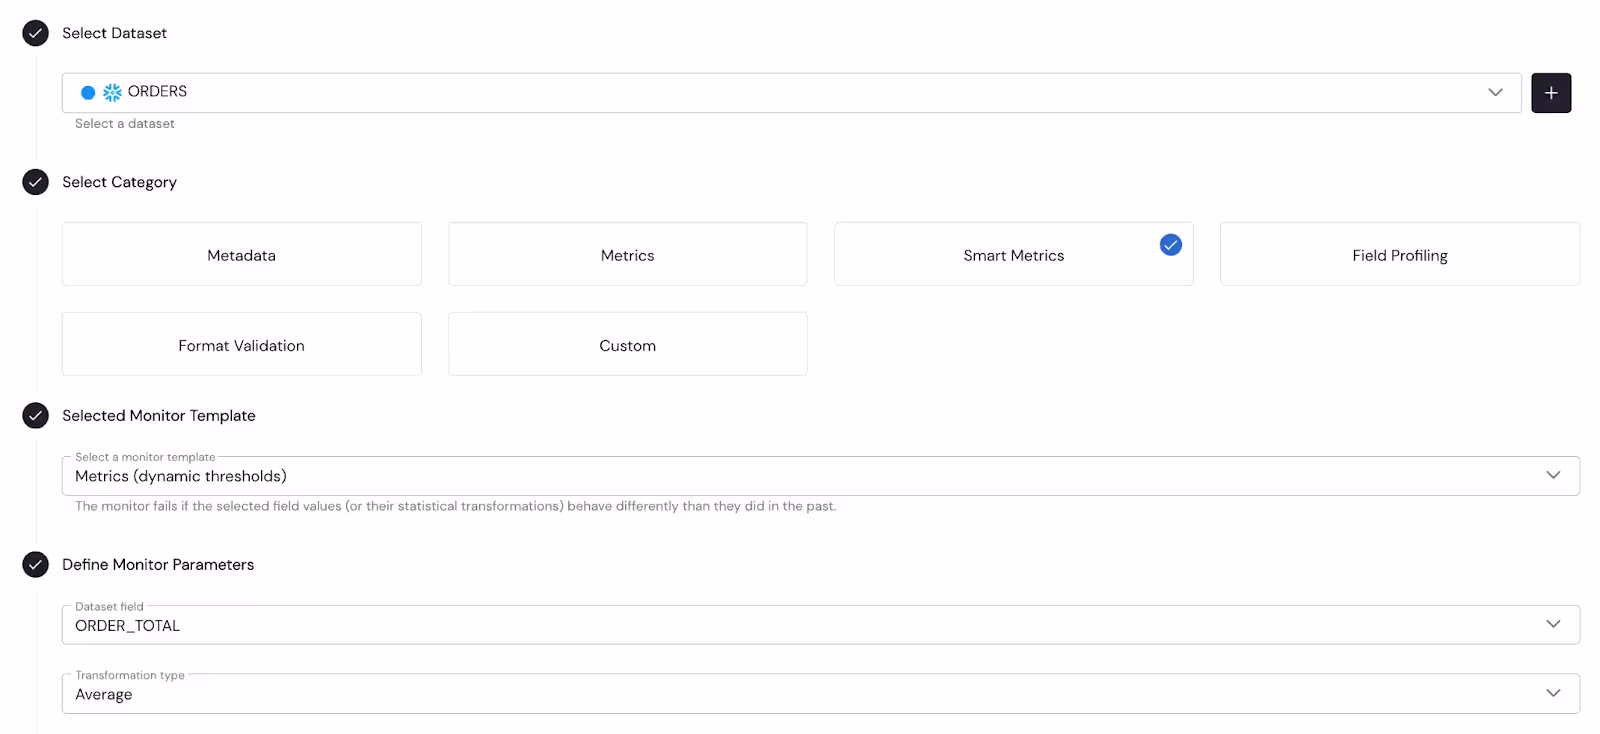
Sifflet comes with a broad suite of monitor templates you can use to monitor your data quality. Sifflet monitors are designed to be created by and to address use cases of both business and technical teams. Members of the operations team, for example, can create a smart metric monitor solely through the UI to be alerted in case the average amount of orders suddenly behaves differently from the usual. A Data Analyst used to writing SQL can decide to write their own custom SQL code to create more sophisticated quality rules.
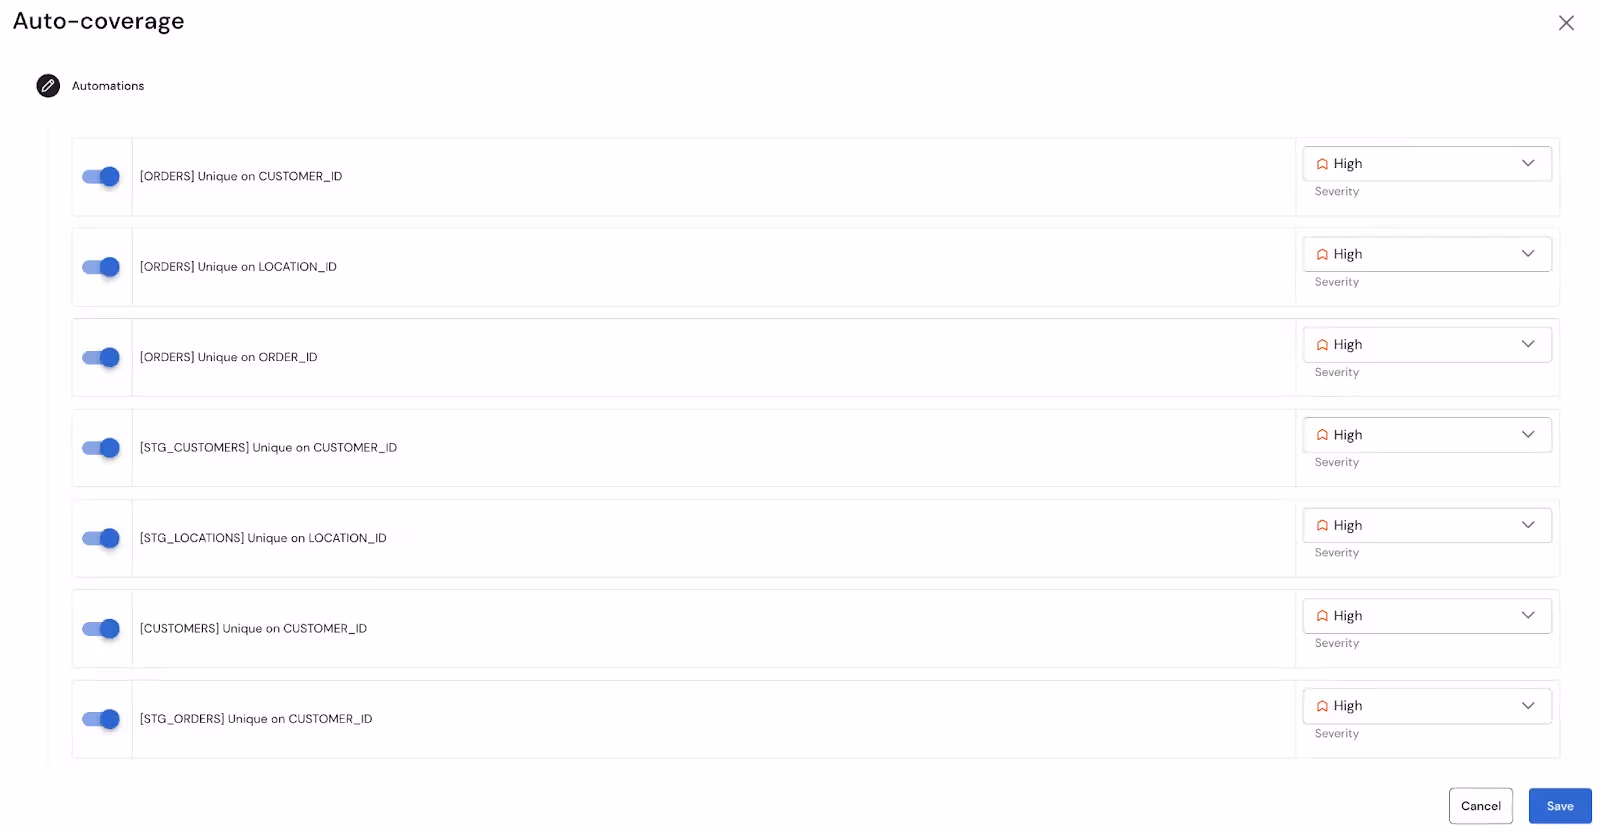
Creating a monitoring suite when starting to use a new data quality product can be very time-consuming, especially when you have a lot of data assets. To avoid losing time migrating your existing data quality rules to Sifflet, you can leverage our auto-coverage capability. Auto-coverage allows you to automate the creation of your monitors on all your freshly collected datasets and get to a high monitoring coverage rate in minutes.
Once configured, you can use your monitors to get alerted on your preferred notification tool (Slack, MS Teams, emails, etc.) in case of issues with your data. You can also leverage Flow stopper to go one step further and proactively spot issues before moving the data further down the pipeline.
Troubleshoot issues faster and collaboratively
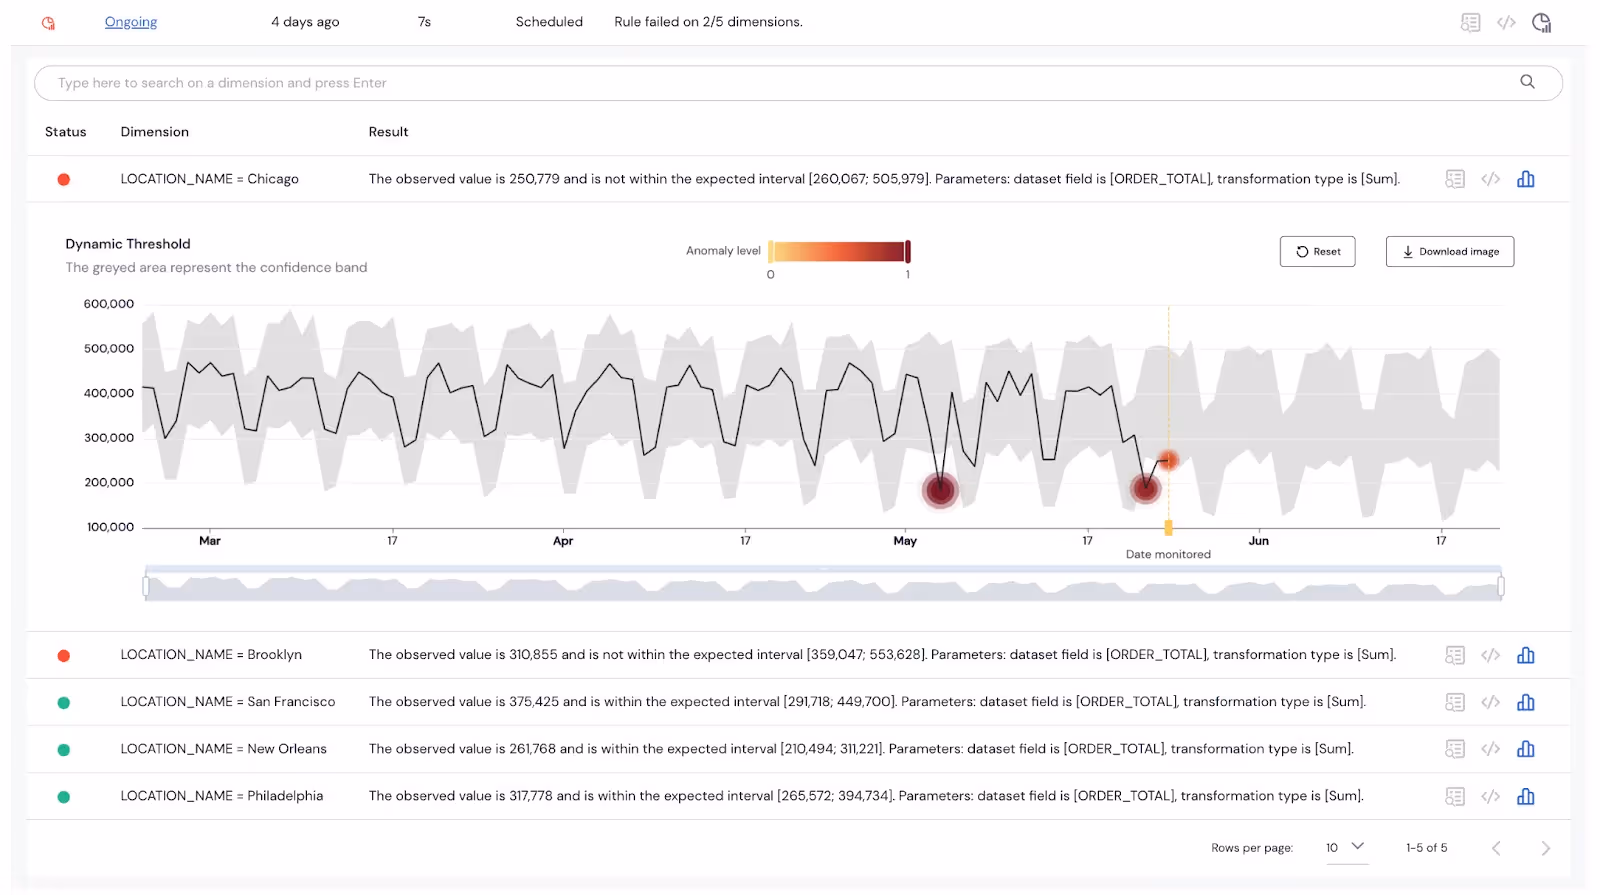
In case of failure, your monitor results come with all the information you need to efficiently understand and troubleshoot the issue. A revenue anomaly detection monitor can for instance include details about the store locations as well as the exact values that triggered the anomaly. The graph associated with the monitor run also allows you to quickly understand how far from the confidence band the detected anomaly was and how it compares to other anomalies that might have occurred in the past.
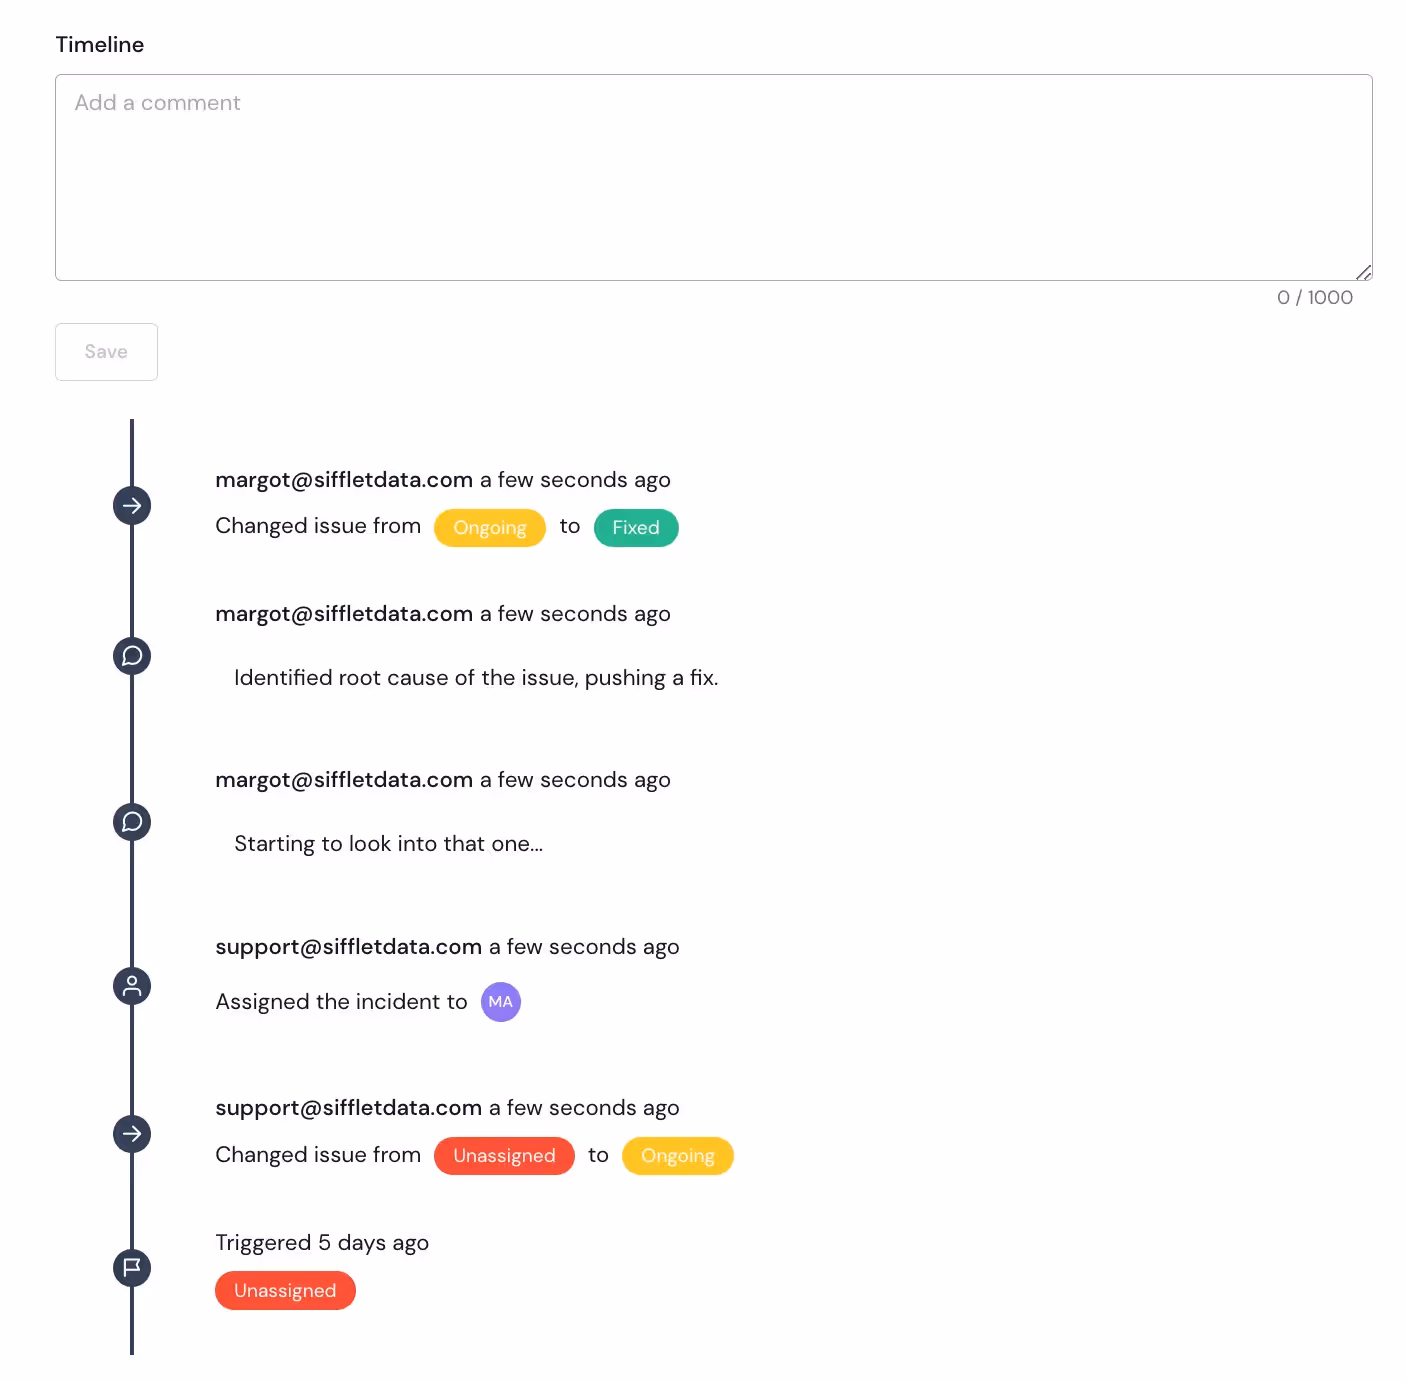
A monitor failure automatically results in the creation of an incident that you can use to collaboratively troubleshoot the issue with your team. Incidents also make it convenient for any impacted teams to proactively follow troubleshooting progress and get warned about problem resolution.
Unleashing the potential of a unified data observability platform
There is not any doubt that both data discovery and governance and data quality testing have immense value of their own.
However, what we firmly believe in, here at Sifflet, is that there is even more value to unlock by bundling these two aspects of data management into a single platform. Having data cataloging and data quality monitoring feeding into one another make your teams feel more confident when using data and more efficient when troubleshooting issues.
De-risk data self-service
Business teams increasingly rely on data analytics to make business critical decisions, but what happens when some dashboard data becomes altered without anybody noticing? Bad decisions and business outcomes might ensue.
This is typically where ensuring your data catalog and lineage are enriched with data quality insights comes in handy.
Every Sifflet dataset asset page features a health status that is based on the number of monitors on this asset and on the severity of incidents that might be impacting it. This health status makes it immediately clear to users whether or not they are safe to start using the table they are looking at.
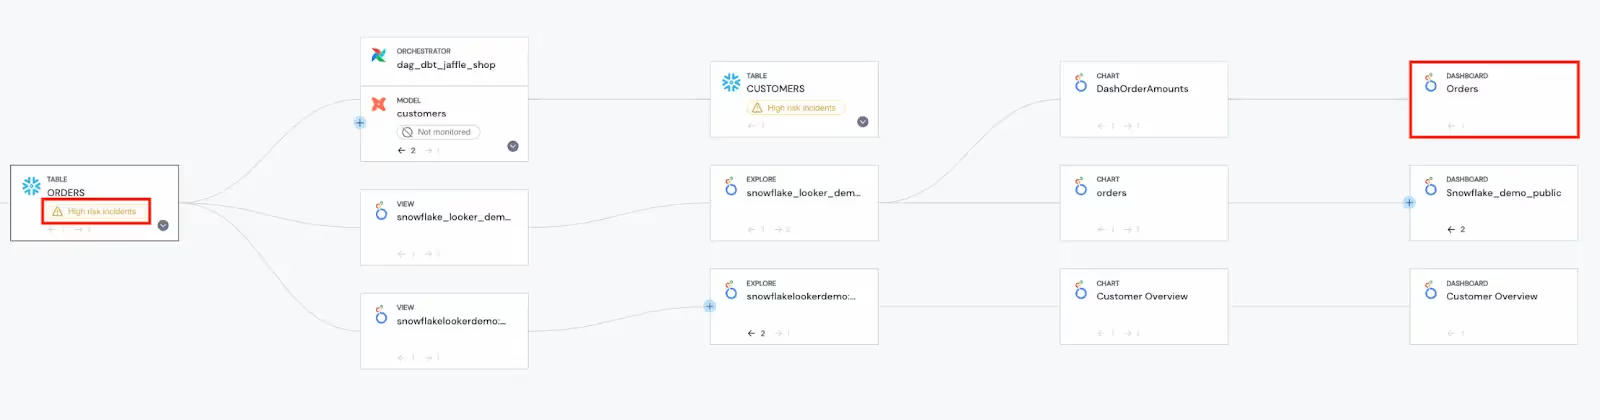
Using their dashboard lineage, business users can also spot any ongoing issue with the upstream data pipeline and consequently make sure the data they are using is reliable before they leverage it for decision making. No more finding out that your report actually contains one full week of accidentally duplicated orders during your monthly results presentation to management!
Take monitoring and troubleshooting to the next level
Building your data quality monitors on top of your data catalog assets also has a lot of benefits.
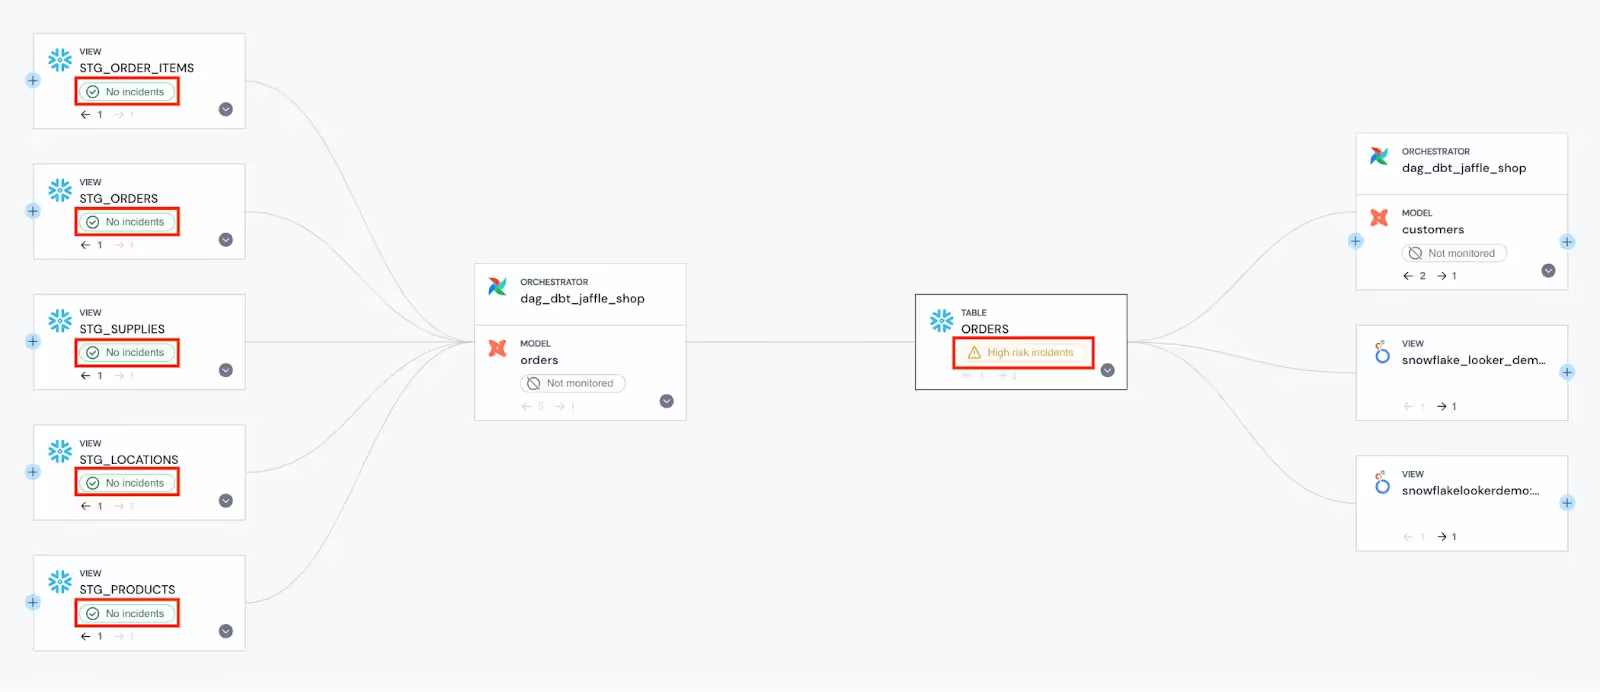
It first takes lineage and root cause analysis to the next level. Because each asset shows up on lineage with its corresponding health status, in case of issue with an asset, not only can data teams quickly identify what are the upstream assets that might be causing the issue, they can also immediately identify where the issue started happening in the data lifecycle. The below lineage for instance seems to indicate that the ongoing issue on the ORDERS Snowflake table might be coming from the transformation step.
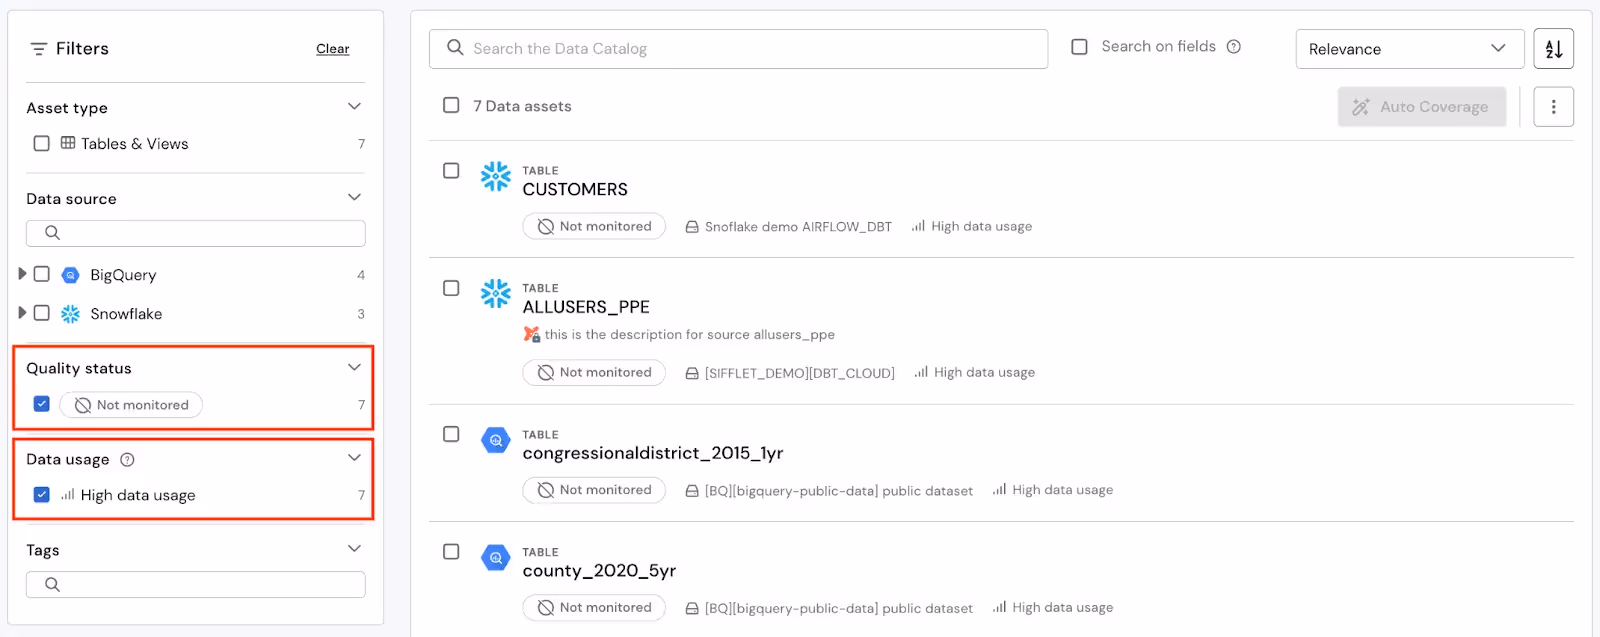
Additionally, because your data catalog and lineage are the single source of truth about your data assets and their usage, you can easily get a sense of your current monitoring coverage and ensure all your critical assets are monitored. By filtering your data catalog on the “High usage” and “Not monitored” filters, you can identify assets on which you are flying blind and start monitoring them in seconds.
Get started with data observability today
You can check out our documentation to learn more about data catalog, lineage, and monitoring features as well as their synergies on the Sifflet platform.
If you are not a Sifflet user but want to learn more about the platform, you can also reach out for a demo of the product.


-p-500.png)
