


Definition: Data monitoring is the constant process of tracking the health, accuracy, and reliability of data as it moves through your systems.You can think of it as the early warning system for your data stack, alerting you when something breaks, drifts, or goes missing before it turns into a business problem.
Understanding Data Monitoring
When your quarterly dashboard shows a mysterious 40% revenue drop, or your recommendation engine suggests parkas in July, you’re not just dealing with bad luck. You’re dealing with bad data.
Data monitoring is the continuous practice of tracking and checking the health of your data. It ensures your numbers are fresh, your systems are in sync, and your pipelines aren’t silently breaking behind the scenes. Think of it as a real-time pulse check for your business's most important asset: information.
Example
Let’s say you’re the Head of Analytics at a fast-growing food delivery startup, ChowNow. ****You’ve built a clean data stack that includes Fivetran, Snowflake, dbt, and Looker, and your team runs daily dashboards on everything from delivery times to customer retention. But one morning, the operations team notices that your “on-time delivery rate” has dropped 15 points overnight.
Clearly, something is off. You investigate and are able to see that the pipeline ran and the dashboard updated. With Sifflet setup to monitor your data, you receive an alert about two issues. The first is a schema change in the GPS tracking table, and a spike in missing values in the order dispatch logs. Within the hour, your team identifies the root cause: an upstream app update broke a key join, and it gets patched.
Thanks to data monitoring, the issue is caught and resolved before it skews your weekly executive report or leads to unnecessary fire drills in the ops team.
In just one quarter, these alerts have helped you fix three silent data failures, each one saving hours of manual investigation and preserving trust in your data. As a result, you spend fewer meetings arguing over metrics and more time making confident decisions.
Data monitoring isn’t just a technical safeguard, it’s a business enabler. When done right, it prevents costly errors, accelerates decision-making, and strengthens trust across teams. The difference between reacting to broken dashboards and proactively preventing data issues often comes down to whether monitoring is treated as a core function or an afterthought.
As the Dashbite example shows, the stakes aren’t abstract. Broken data causes real disruptions for customers and operations. But with strong monitoring in place, teams can catch problems early, fix them fast, and keep everything running smoothly.
If your business depends on data (and every business does!) then monitoring isn’t optional. It’s the first step toward confident, scalable, data-driven growth.
How Does Data Monitoring Fit Into Data Observability?
Data monitoring is only a small part of data observability. Full observability gives you full visibility into your data’s movements, changes, and how it can impact your business.
Data monitoring is ultimately in charge of keeping an eye on your data and letting you know where there is a flaw.
Data monitoring in on of 3 components in data observability.
- Data monitoring
Tracks key indicators like freshness, accuracy, and volume. This is your data's vital signs, or the baseline measurements that tell you when something's off.
Without monitoring, observability has nothing to observe. But without observability, monitoring is just a blinking dashboard light. It produces lots of noise, but gives little insight into what actually needs fixing.
Shows how data flows across systems, so you can trace issues to the source.
When a financial report shows inconsistent numbers, lineage mapping helps you track the problem back through transformations, joins, and source systems to find the exact point of failure.
- Data Profiling
Analyzes the content of data for anomalies, outliers, or quality issues.
It's the difference between knowing that 15% of your customer records are incomplete and understanding exactly which fields are missing and why.
Why Monitoring Matters (and The Consequences of Not Monitoring)
Broken data ripples throughout your entire organization. It occupies data engineers’ time, delays decisions, damages customer experience, and ultimately, can ruin your business’ image.
The cost of poor data quality compounds quickly because bad data creates bad decisions, which create more bad data.
The main issues of not monitoring your data include losing revenue, customer trust, and increasing customer churn.
Leading with inaccurate data can cause you to miscalculate usage-based billing or publishing nonexistent products or sales. All these make users lose trust in your business, and, eventually, walk away.
After all, no one likes being cheated.
Additionally, wrong or corrupted data can also lead to higher costs and operational inefficiencies. For instance, A logistics firm upgrades its traffic sensor network, but no one monitors data compatibility. Algorithms start optimizing based on faulty inputs. Consequently, trucks take inefficient routes, fuel costs surge, and customer complaints rise.
Lastly, in many industries, submitting flawed data could increase regulatory and compliance risks. Particularly in pharmaceutical trials, that could have serious impacts on patients.
So, essentially, monitoring your data will guarantee that it is accurate and up-to-date, and that will build a solid foundation for the rest of your operations.
6 Important Data Monitoring KPIs
As you set out on establishing a data monitoring strategy, it’s important not to try and monitor everything.
To actually predict business problems with implications for your operations and revenue, focus on these 6 high-impact signals:
1. Freshness
Is your data recent enough to act on?
The key here is to match your freshness requirements to how your business actually runs. For example, a stock trading platform needs market data within milliseconds, whereas a quarterly business review can tolerate data that’s a few hours old.
2. Completeness
Are there any key fields in your tables that are missing, null or void?
It’s important to track completeness for fields that have a direct impact on downstream processes. Partial financial records delay month-end closing for the finance team, while incomplete customer addresses slow down shipping.
3. Accuracy
Does the data reflect reality?
Monitoring for accuracy catches both systemic errors and random data corruption. Your product prices shouldn’t randomly spike to $999,999.
4. Consistency
Do your data values match across systems?
Inconsistencies often signal integration problems, or conflicting business rules. Without consistency and alignment, nobody across the business is looking at the same numbers, whether they’re looking at customer views or financial metrics across business units.
5. Schema stability
Has the structure of your data changed unexpectedly?
This often occurs when one business unit adds a field to your tables… without notifying other units. If marketing adds a new customer preference field or finance changes transaction categorization, your downstream pipelines need to adapt, or silent schema drafts can break reports and machine learning models without obvious symptoms.
6. Volume anomalies
Are there sudden spikes or drops in data flow?
Unusual or fishy volume patterns can indicate system failures, a problem with data collection, bot activity, or significant business changes. A 50% drop in customer activity data might mean tracking is broke…but it might also mean your biggest customer just churned. Monitoring can help you tell.
It’s important to note that different industries prioritize different data monitoring KPIs based on their risk profiles.
Certain industries have tighter regulatory and compliance standards than others. A few examples include:
- Financial Services Industry (FSI)
- Insurance
- Healthcare and Pharmaceutical
- Retail
- Manufacturing
The Data Monitoring Lifecycle
Good monitoring is more than dashboards and alerts. It's a full process that turns data problems into learning opportunities, through a 5 step lifecycle:
Step 1: Assess
Identify high-value data assets and their business importance.
Not all data deserves the same level of monitoring attention…and too many inconsequential monitors can create alert fatigue.
For instance, customer payment data needs more scrutiny than internal meeting room booking logs.
Step 2: Set thresholds
Define what "good" looks like based on business requirements, not just technical defaults.
If data quality doesn’t align with how the business operates, downstream problems persist. It’s useless to alert on 12-hour delays if marketing’s campaigns can function effectively with customer data that’s 24 hours old.
Step 3: Automate detection
Use tools and machine learning to flag issues in real time.
Modern monitoring systems use machine learning to understand your data’s normal patterns and detect meaningful deviations while filtering out expected variations.
Step 4: Route alerts
Prioritize notifications based on business impact, not technical severity.
A minor data quality issue affecting internal reporting should generate a low-priority ticket, while problems affecting customer-facing applications should trigger immediate escalation to on-call teams.
Step 5: Resolve and improve
Investigate root causes, document fixes, and implement prevention measures. Use each incident as an opportunity to strengthen monitoring coverage and prevent similar issues in the future.
The best monitoring systems integrate into existing workflows rather than creating new overhead. Teams should receive alerts through their preferred channels, such as Slack, email, or ticketing systems, with enough context to take immediate action.
Scalable Data Monitoring Techniques
When it comes to data monitoring, different use cases require different monitoring approaches.
To successfully scale your monitoring, align your business requirements with your data characteristics:
- Statistical process control
This technique uses historical patterns to flag anomalies. This is perfect for metrics with predictable behavior, like daily active users or transaction volumes. A telecommunications company might use this to monitor network performance metrics that typically follow consistent daily patterns.
- Rule-based checks
These checks apply business logic and hard constraints.
A few examples include "no product can cost $0," "customer ages must be between 13 and 120," or "shipping addresses must include postal codes."
These catch obvious data corruption and business rule violations.
- ML-based anomaly detection
Machine learning is able to catch subtle shifts and complex patterns that rules miss.
A financial institution might use ML to detect unusual transaction patterns that could indicate fraud or data collection problems, especially when dealing with seasonal variations and evolving customer behavior.
- Stream monitoring
Stream monitoring helps you track real-time data as it flows through your systems.
This is essential for applications like GPS tracking, market data feeds, or IoT sensor networks where data value degrades rapidly and immediate detection is crucial to operations.
The 5 Best Data Monitoring Tools
Not all monitoring tools are created equal. Here's a quick overview of how leading platforms stack up for different organizational needs:
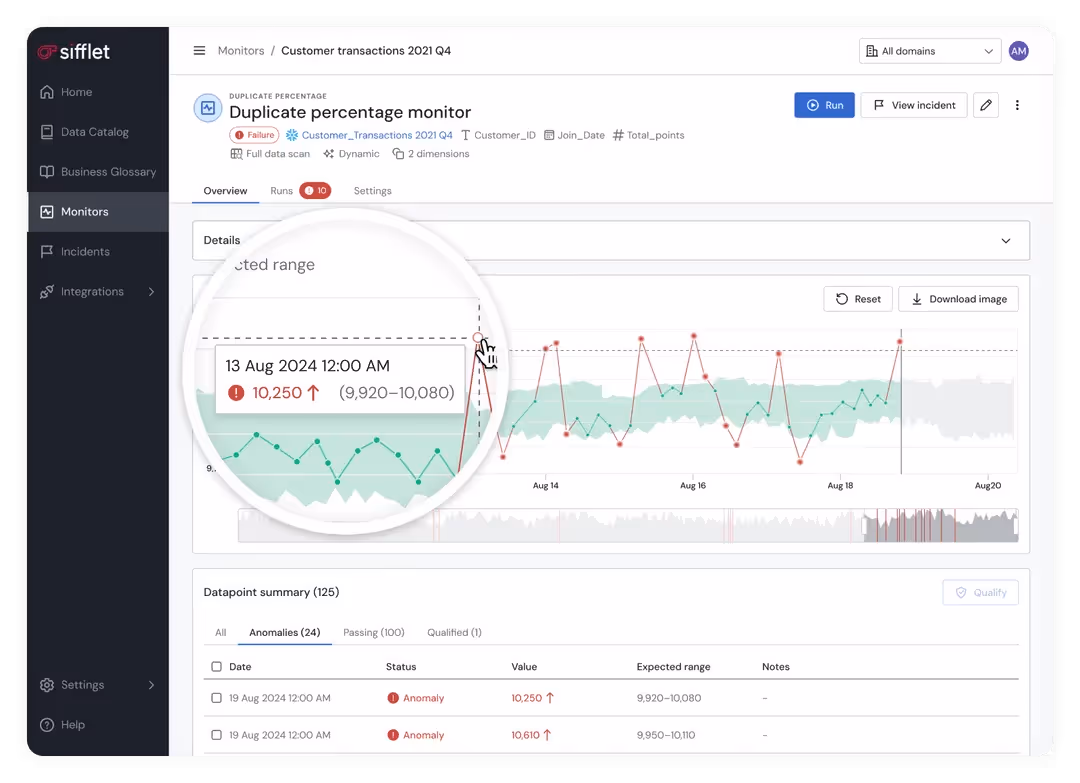
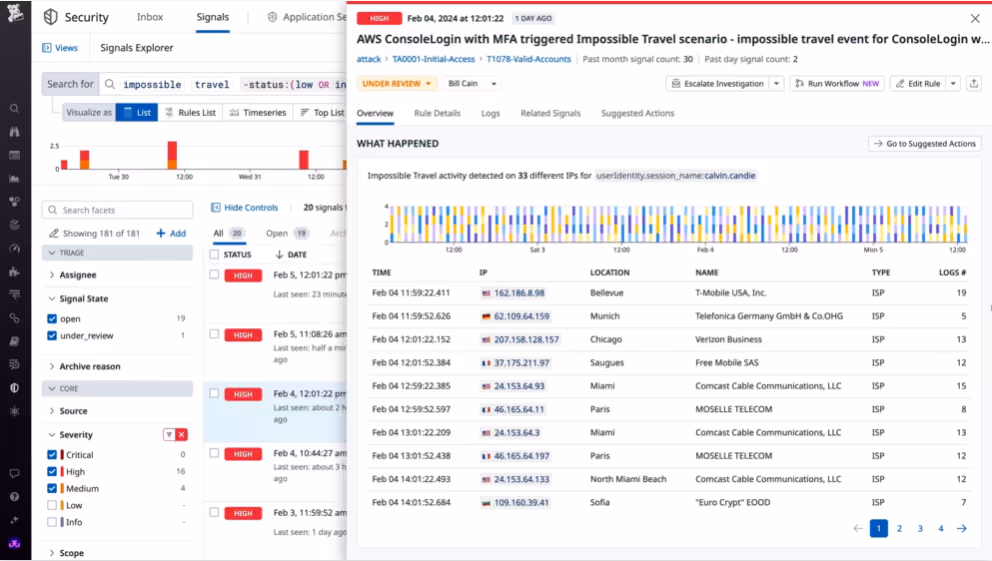
1. Sifflet
Full observability platform combining monitoring, lineage tracking, and business impact analysis.
Excels at connecting technical metrics to business outcomes with business-aware alerting and no-code setup. Best for organizations where data quality directly impacts customer experience and revenue.
2. Monte Carlo
Data reliability platform focused on preventing data downtime through automated anomaly detection.
Monte Carlo is strong at scale thanks to its comprehensive connector libraries, and ideal for large organizations with complex data environments and dedicated data engineering teams.
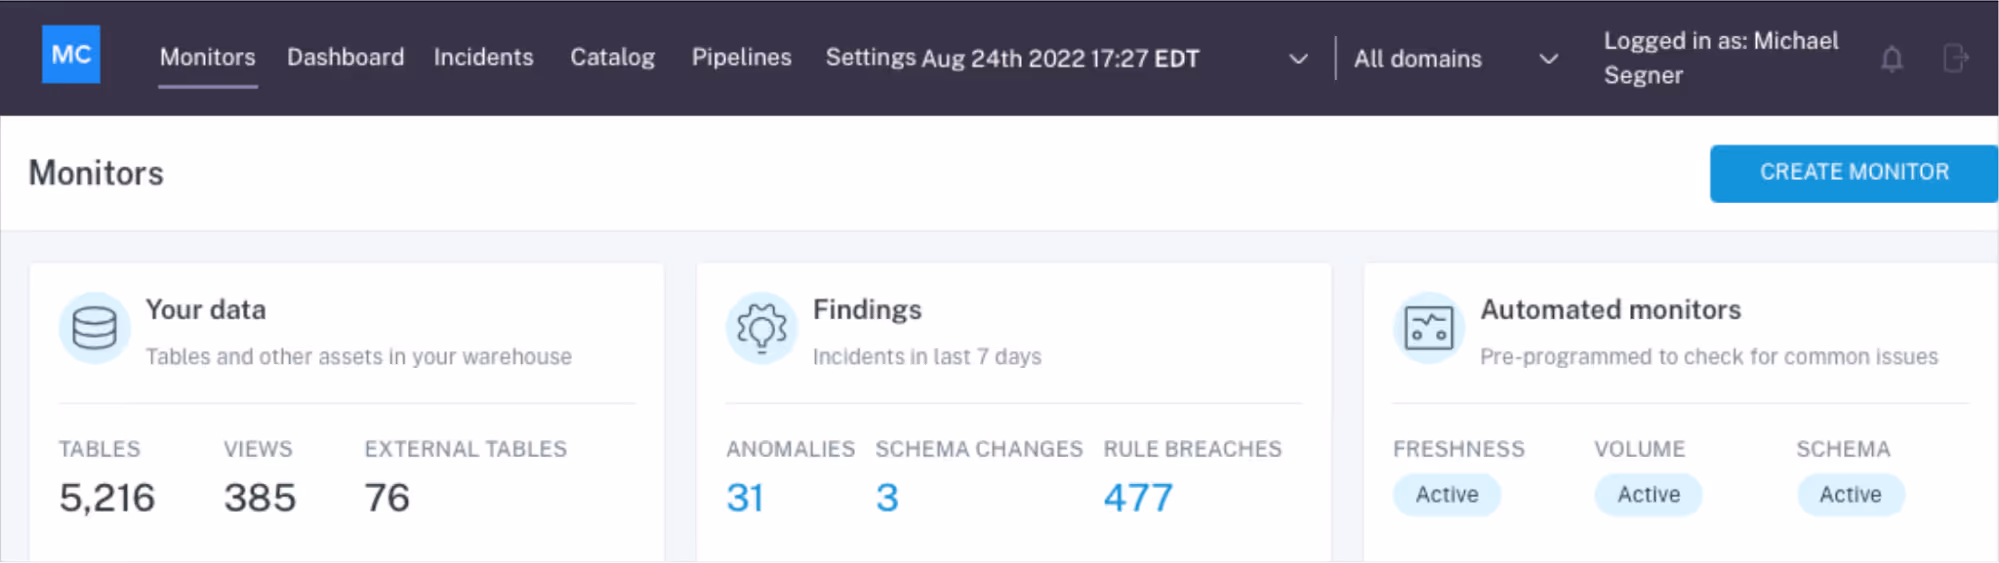
Source: Monte Carlo
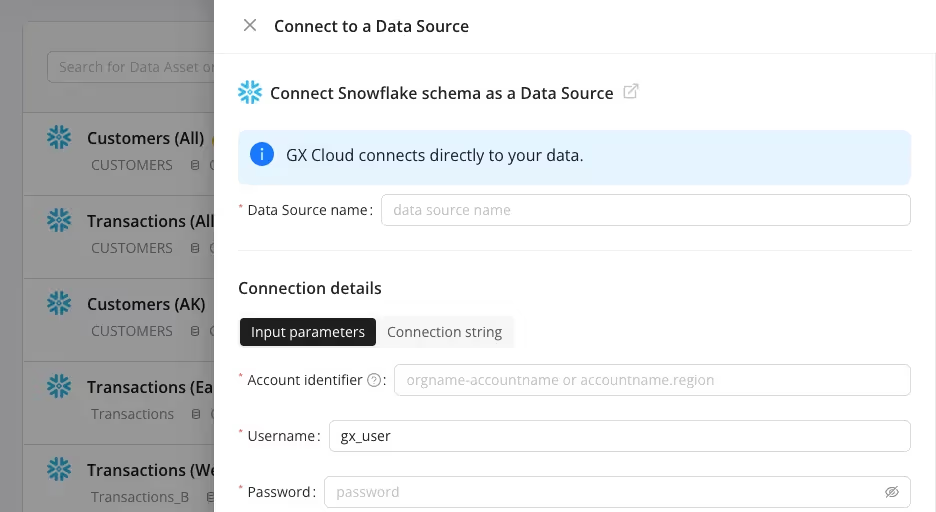
3. Great Expectations
Open-source validation framework offering highly customizable monitoring rules and extensive documentation capabilities.
Great Expectations is best suited to technical teams that want full control over monitoring logic and integration with existing development workflows.
4. Datadog (Data Monitoring)
Datadog is most well known for its APM capabilities and has more recently extended infrastructure monitoring to include data pipeline observability.
It’s a good fit for organizations already using Datadog for application and infrastructure monitoring who want unified data pipeline observability across their entire tech stack.
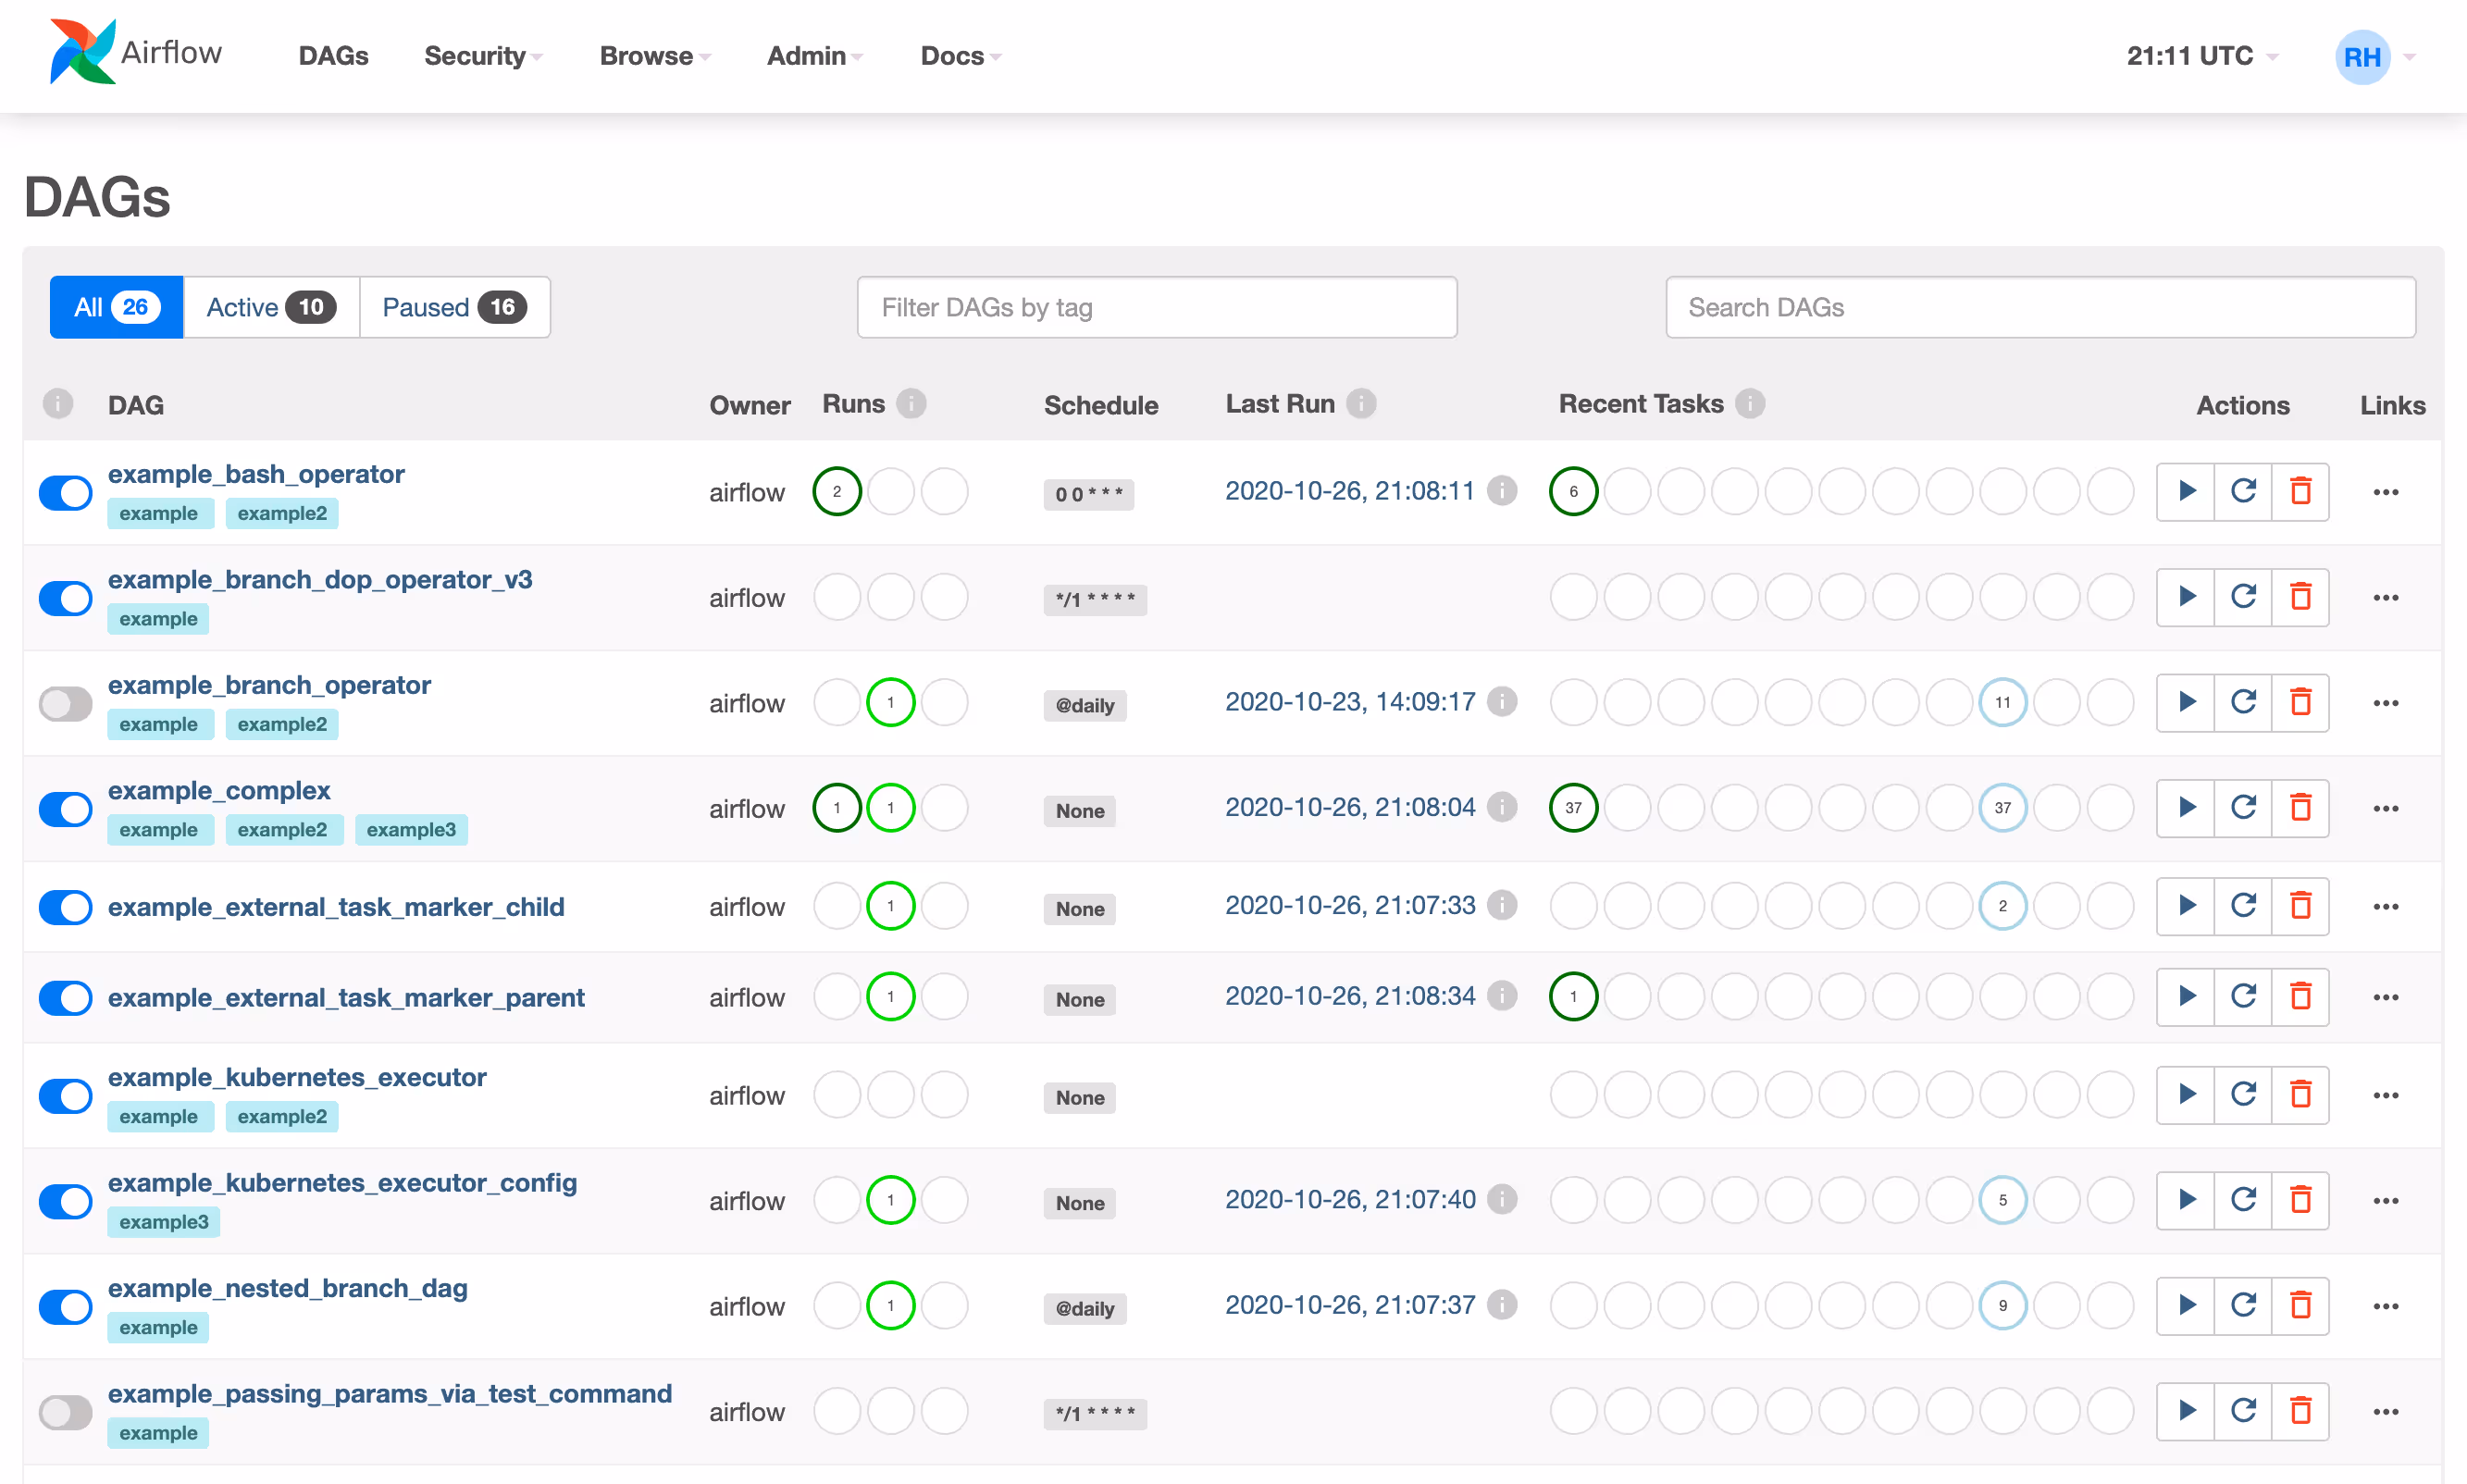
5. Apache Airflow + Custom Checks
Workflow orchestration platform with custom monitoring logic via DAGs and sensors.
This option is ideal for organizations with complex data workflows, strong technical teams, and specific monitoring requirements that off-the-shelf tools don't address.
Data Monitoring vs. Data Observability
Understanding the distinction between data monitoring and data observability helps organizations build more effective data strategies.
Here’s a side by side comparison:
Monitoring gives you signals, while observability gives you clarity and context. You need both to turn data problems into competitive advantages.
The Role of a Data Monitoring Committee
Finance and security get strategic oversight… and so should your data.
This is where a data monitoring committee comes in.
Their job? Bring governance, accountability, and cross-functional alignment to data quality initiatives.
The Data Monitoring Committee’s are in charge of:
- Defining quality standards and monitoring priorities based on business risk
- Coordinating response procedures across technical and business teams
- Reviewing and updating monitoring strategies as business needs evolve
- Establishing escalation procedures for different types of data incidents
- Allocating resources for monitoring infrastructure and tooling
An effective data monitoring committee ****is composed of data engineers (technical implementation), business analysts (domain expertise), compliance teams (regulatory requirements), and domain owners from key business units like marketing, finance, and operations.
The committee ensures that monitoring efforts focus on business-critical data rather than just technical convenience, helping answer questions like "Should we prioritize customer data accuracy or inventory forecasting reliability?" based on actual business impact.
Limitations of Data Monitoring
Although monitoring your data is crucial to achieve quality data, it cannot stand alone.
Monitoring alone comes with several limitations, including the fact that without a full observability system, you would only be receiving organized noise that creates alert fatigue without driving meaningful improvement.
Some other limitations include:
- It doesn't fix problems automatically
You’ll still need response workflows, clear ownership, and technical capabilities to address issues. Knowing that customer data is 15% incomplete is valuable only if someone can clean it up and prevent future incompleteness.
- It lacks business context
Technical anomalies aren't always business issues, and business-critical problems don't always trigger technical alerts. A 20% drop in mobile app events might indicate tracking problems… or reflect successful efforts to reduce spam.
- It reacts rather than prevents
Traditional monitoring responds to problems after they occur. You need pattern analysis, predictive capabilities, and process improvements to prevent issues before they impact business operations downstream.
- It generates data about data problems
Without clear resolution procedures and business priority frameworks, monitoring creates another data quality challenge, which is knowing what alerts to prioritize and what to ignore.
In short, monitoring is necessary for data reliability, but it's not sufficient to create a data-driven, competitive advantage.
How to Turn Monitoring into a Competitive Advantage
If your C-suite trusts data quality, they make decisions faster and with greater conviction. Reliable data transforms quarterly planning from a guessing game into a strategic advantage.
Monitoring ensures that personalization engines, recommendation systems, and customer service tools work with accurate, current information, creating more satisfying customer interactions.
Proactive monitoring prevents small data issues from becoming operational crises, reduces firefighting, and enables teams to focus on value creation rather than problem solving.
Systematic monitoring helps organizations maintain compliance with data protection and industry regulations, all while reducing audit risk and regulatory scrutiny.
Early detection of data problems costs far less than fixing corrupted reports, reconciling financial discrepancies, or rebuilding customer trust after service failures.
Most importantly, monitoring creates the feedback loop that powers continuous improvement, transforming every data incident into an opportunity to strengthen your data infrastructure and business processes.
Data Monitoring Done Right…
Monitoring without resolution is just noise, without context is just numbers, and without business alignment is just busywork.
Competitive advantage can be created by connecting technical health to business outcomes.
When implemented well with a strong strategy, data monitoring is about building organizational confidence in data-driven decision making and data products, creating the foundation for innovation and competitive edge, not just preventing disasters.
That’s why Sifflet helps businesses turn monitoring into momentum by connecting metrics to meaning, alerts to action, and data problems to business solutions.
If you’re ready to go beyond red flags and build data infrastructure that actually drives business value, discover how Sifflet can help!
%2520copy%2520(3).avif)


-p-500.png)
