


As your whole organization’s data flows through your pipeline, flaws can occur, the problem is that these flas continue to flow downstream, negatively impacting dashboards, reports, and business decisions.
How can you avoid this?
Data pipeline monitoring will help you ensure that your data is accurate during its entire lifecycle. From ingestion to consumption.
Definition: Data pipeline monitoring is the practice of tracking the health, performance, and reliability of your data pipelines, from ingestion to transformation to delivery.
It guarantees that your data doesn’t break silently. If something does break, you can easily track the issue and fix it before it reaches your dashboards so business teams do not operate on outdated or incorrect information.
What is a Data Pipeline?
Think of a data pipeline as your organization's digital assembly line.
Just as a manufacturing assembly line transforms raw materials into finished products through a series of coordinated steps, a data pipeline moves raw data through various stages of processing, transformation, and delivery.
A typical data pipeline might extract customer transaction data from your point-of-sale systems, transform it by cleaning inconsistencies and calculating metrics, then load it into your data warehouse where analytics teams can access it for reporting.
Each step depends on the previous one working correctly. In your data pipeline, when one step fails, the entire process can grind to a halt.
To put it into a practical example, you run analytics at a major retail brand.
One day, the dashboard your execs use to track daily sales stops updating without a warning or an alert. It turns out a schema change in your point-of-sale system broke the pipeline feeding your data warehouse.
Marketing keeps optimizing campaigns based on stale numbers. Finance uses last week’s data to plan restocks. It takes three days and a swarm of Slack messages to trace the issue and rebuild trust.
If data observability had been in place, it would have flagged the schema drift the moment it happened and you could have fixed it before bad data made its way into business decisions.
Monitoring your data pipelines isn’t just about catching errors. It’s about protecting your business from blind spots, building confidence in data, and scaling operations without scaling chaos.
Types of Data Pipeline Errors
Your data pipeline's health directly impacts your business operations.
When pipelines run smoothly, decision-makers receive timely, accurate information. When they don't, the consequences ripple throughout your organization.
Therefore, when pipelines break, they don’t just annoy engineers, they derail decisions.
There are 4 main types of data pipelines you should watch out for.
1. Data quality issues
Data quality issues occur when data is inaccurate, incomplete, inconsistent, or fails to meet expected standards across your pipelines.
For example, imagine a healthcare network where patient scheduling data becomes corrupted during pipeline processing.
Appointment slots might show as available when they're actually booked, leading to double-bookings, frustrated patients, and potentially delayed medical care.
The financial impact extends beyond immediate operational costs to include damage to patient satisfaction scores and regulatory compliance risks.
To avoid this issue, you should check the quality of your data regularly with a data observability tool like Sifflet.
- Schema drift
Schema drifts occur when the structure of your data changes unexpectedly. Schema drifts can include changes in field names, data types, field order, or addition and removal of fields.
To put it in practical terms, if your marketing team's CRM system updates and suddenly includes additional customer preference fields, your existing pipeline might not know how to handle this new data structure.
As a result, critical customer insights get dropped, leaving your personalization algorithms working with incomplete information and reducing campaign effectiveness.
- Data freshness problems
Data freshness is a contributing factor in data quality, outdated data can cause problems. Not updating your data regularly can impact your data pipeline and fail to support timely decisions or operations.
For example, a retail chain's inventory management system relies on fresh sales data to trigger restocking orders.
If the pipeline delivering this data experiences delays, stores might run out of popular items during peak shopping periods while simultaneously over-ordering slow-moving inventory.
- Pipeline failures
These happen when a data pipeline breaks or stalls, preventing data from flowing through its intended path.
Consider a financial services firm whose risk assessment pipeline fails during market hours.
Without real-time risk calculations, trading decisions become blind bets, potentially exposing the organization to millions in unexpected losses during volatile market conditions.
How to Monitor Your Data Pipeline?
Effective data pipeline monitoring requires a strategic approach that balances technical oversight with business awareness.
The objective isn’t just to catch errors after they happen, it’s to prevent disruptions before they impact the business.
Start by including proactive alerting.
Intelligent alert systems should notify relevant teams before minor issues escalate. Rather than relying on end users to report missing or delayed data, monitoring tools should detect anomalies and trigger automated responses in real time.

Continue by integrating business context. The most impactful monitoring strategies go beyond technical metrics to link performance directly to business outcomes.
For example, instead of merely tracking "data processing latency," teams might monitor "time to customer insight delivery" or "delay in financial reporting availability."
Multi-layer monitoring will allow you to maintain full visibility, meaning you must monitor each stage of the data pipeline.
This comprehensive view allows teams to quickly pinpoint issues and assess their downstream consequences.
Don’t forget to implement automated recovery, it can significantly reduce downtime and manual intervention.
When common issues arise, such as a temporarily unavailable data source, an effective monitoring system can automatically retry failed jobs or switch to backup data sources, keeping operations smooth and uninterrupted.
Metrics in Pipeline Monitoring
There are four main metrics that will help you understand what to measure and help you gain a business advantage.
1. Traffic: Tracks how much data is flowing and where.
For example, manufacturing company might track the number of sensor readings processed per hour from factory equipment. Sudden drops could indicate equipment failures, while unexpected spikes might signal the need for additional processing capacity.
2. Errors: Tracks the frequency and type of pipeline errors.
A telecommunications provider monitoring customer service interactions would want to know not just that data processing failed, but whether the failure affected billing accuracy, service quality metrics, or customer satisfaction scores.
3. Latency: Measures how long data takes to move through the system.
For a logistics company, for example, tracking the time between shipment status updates and customer notification delivery directly impacts customer experience and operational efficiency.
4. Saturation: Monitors system capacity and bottlenecks.
Perhaps a media streaming service needs to ensure their content recommendation pipelines can handle peak viewing hours without degrading performance or failing to deliver personalized suggestions.
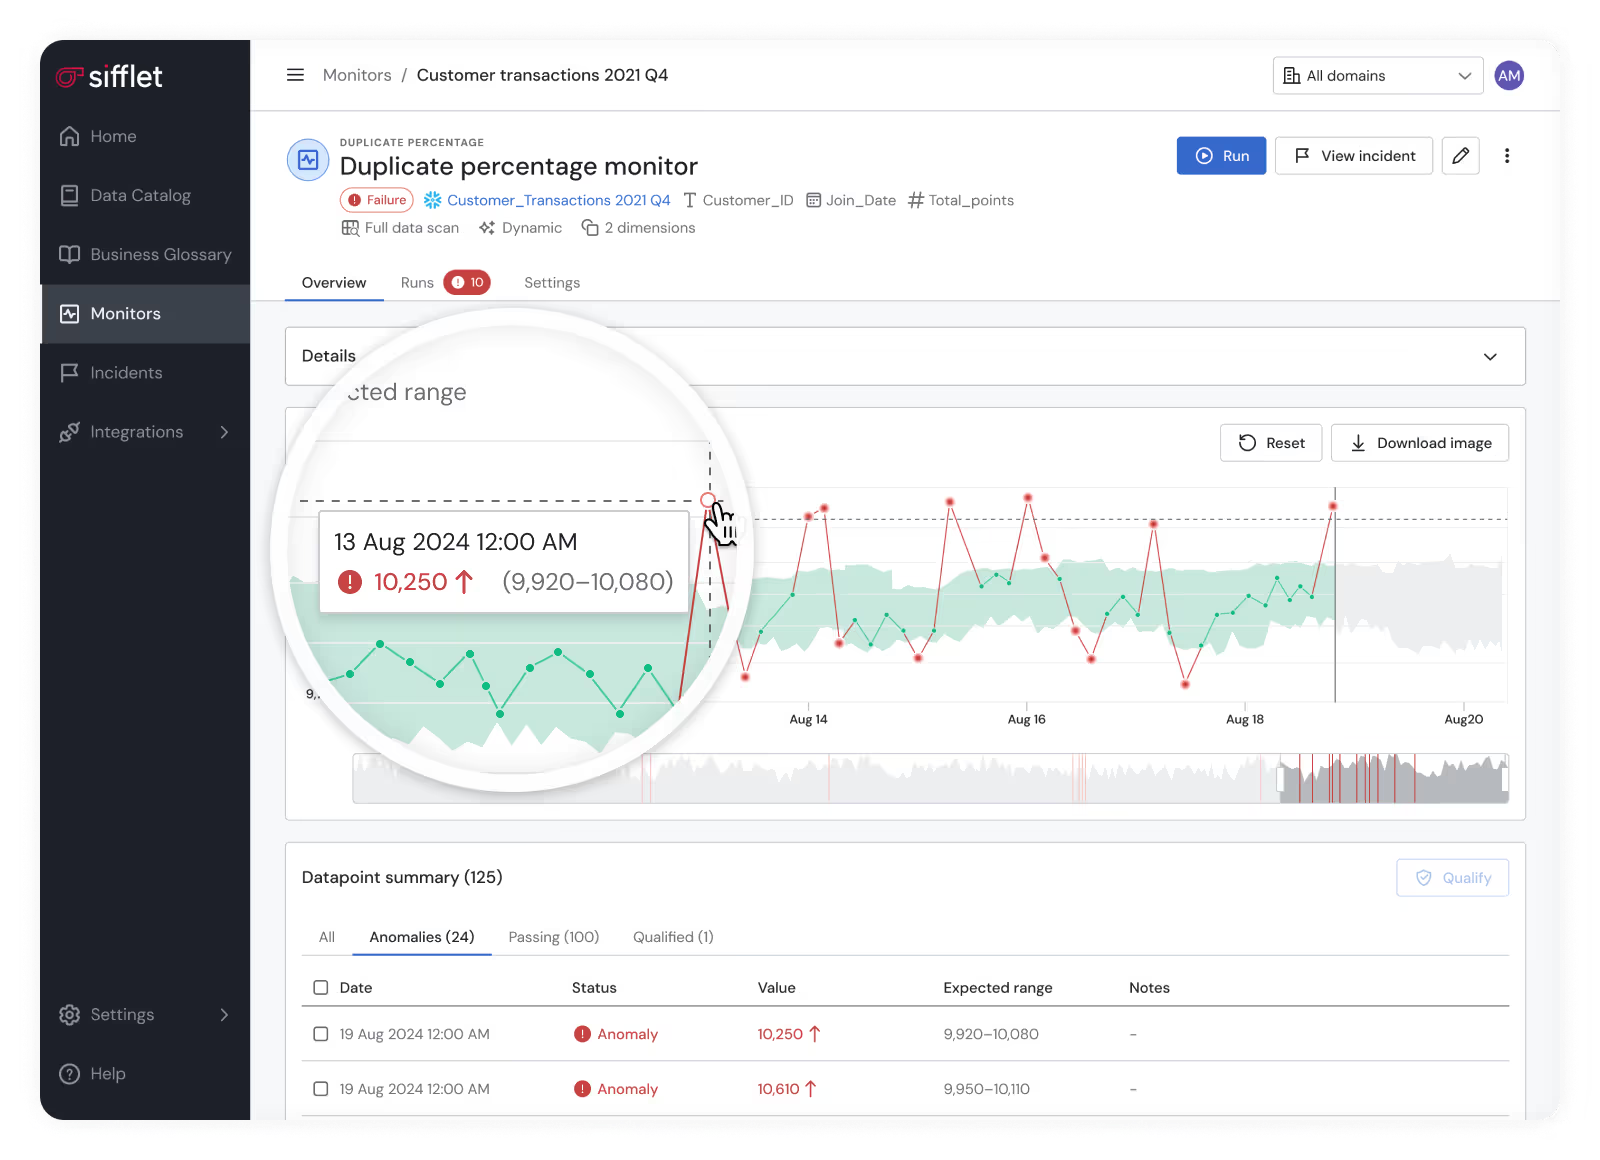
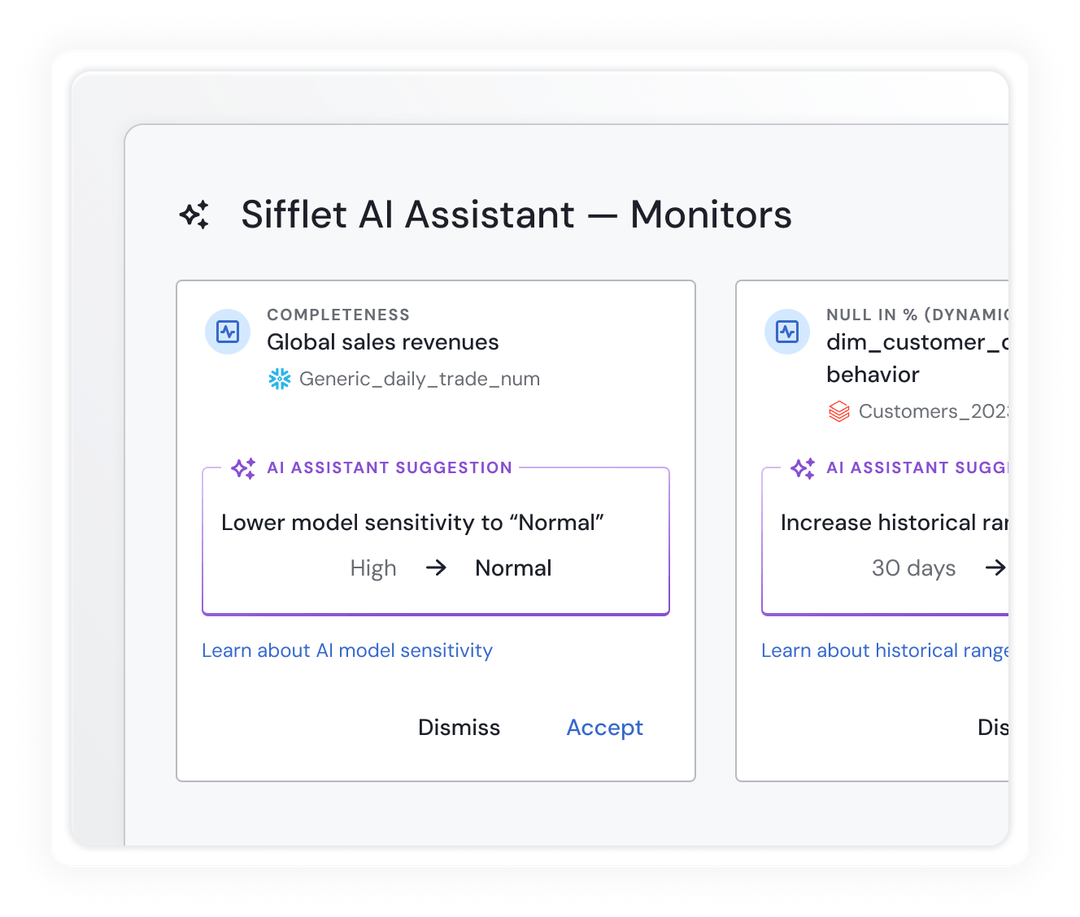
With tools, like Sifflet, you can use the AI assistant to suggest relevant monitors.
What is a Data Pipeline Monitoring Dashboard?
A data pipeline monitoring dashboard serves as your organization's data health command center.
It act as a centralized view that translates complex technical metrics into actionable business intelligence.
A great pipeline dashboard is like an instrument panel in the cockpit of an airplane.
Just like an airplane pilot needs immediate and up-to-date visibility into engine performance, fuel levels, and navigation systems, data leaders need real-time visibility into pipeline health, data quality, and business impact metrics.
The dashboard should include information from your data infrastructure, presenting it in a format that allows quick decision-making.
Rather than forcing business leaders to interpret raw technical logs, an effective dashboard highlights what matters most: Are our pipelines supporting business objectives?
These dashboards aren’t exclusive to data engineers. Different team members use monitoring dashboards for different purposes.
Data engineers focus on technical performance metrics and error resolution, while business analysts examine data freshness and quality indicators that affect their reports. Executive leadership, on the other hand, looks for high-level health indicators and business impact summaries.
During incident response, the dashboard becomes particularly valuable, helping the time to quickly identify affected pipelines, understand business impact, and coordinate response efforts when issues arise, all from a single interface.
Without centralized monitoring, organizations operate blind to data infrastructure health until problems manifest as business disruptions. By the time revenue reports show discrepancies or customer-facing applications display incorrect information, the damage is already done.
There are 5 indispensable components in your dashboard, including:
- Real-time status indicators → Visual representations of overall pipeline health, similar to traffic lights that immediately communicate system status.
- Business impact metrics → KPIs that connect technical performance to business outcomes, such as "revenue reporting freshness" or "customer data accuracy scores."
- Historical trend analysis → Charts and graphs showing performance patterns over time, helping identify seasonal variations, capacity planning needs, and long-term reliability trends.
- Alert management interface → Centralized view of active alerts, their priority levels, and response status, enabling coordinated incident management.
- Resource utilization monitors
Real-time and historical views of infrastructure capacity, helping teams understand when scaling becomes necessary.
Data Pipeline Monitoring Dashboard Example
Let's imagine how a fictional pharmaceutical research company, MedAdvance Therapeutics, uses their data pipeline monitoring dashboard to manage clinical trial data processing.
MedAdvance runs multiple concurrent clinical trials across different therapeutic areas.
Each trial generates large amounts of patient data, lab results, and adverse event reports that must be processed, validated, and made available to research teams within strict regulatory timeframes.
Their monitoring dashboard displays six key sections:
- Trial data ingestion status
Shows real-time processing status for each active trial site.
Green indicators show normal processing, yellow indicates minor delays, and red flags critical issues requiring immediate attention.
- Regulatory compliance metrics
Tracks data processing timeframes against FDA requirements.
A prominent counter would display "Days until regulatory submission deadline" for each trial phase, with pipeline health status directly tied to meeting these critical dates.
- Data quality scorecard
Displays completeness and accuracy metrics for patient records, lab results, and safety reports.
The dashboard highlights when data quality scores drop below acceptable thresholds, potentially impacting trial validity.
- Resource utilization panel
Shows compute and storage utilization across their data processing infrastructure.
During peak trial enrollment periods, this helps the team proactively scale resources before performance degrades.
- Alert summary
Lists active issues prioritized by business impact.
For example, "Lab result processing delay - Trial XYZ-001" appears with high priority because it affects a Phase III trial nearing completion.
- Historical performance trends
Graphs showing pipeline performance over the past months, helping identify patterns and plan for upcoming trial milestones.
- Business Impact
This dashboard enabled MedAdvance to reduce trial data processing delays by 60%, improve regulatory submission accuracy, and avoid potential delays that could have cost millions in extended trial duration.
How to Run a Data Pipeline Audit
Regular pipeline audits ensure your monitoring strategy remains aligned with evolving business needs and technical requirements. You can think of an audit as a comprehensive health check that examines both current performance and future readiness.
A data pipeline audit requires 4 steps:
- Step 1: Assess your pipeline
Begin by cataloging all active pipelines and their business purposes.
Make sure to document data sources, processing steps, and end-user dependencies. Many organizations discover "shadow pipelines" during this phase. These are critical data flows that developed organically without formal monitoring.
- Step 2: Analyze your performance
Evaluate current monitoring coverage against business priorities.
Are your most critical business processes adequately monitored? Do your alerts provide sufficient advance warning of potential issues?
- Step 3: Identify issues
Compare your current monitoring capabilities against industry best practices and your organization's risk tolerance.
Consider factors like data freshness requirements, acceptable error rates, and business continuity needs.
- Step 4: Design a monitoring plan
Develop a roadmap for enhancing your monitoring strategy, prioritizing improvements based on business impact and implementation complexity.
Types of Data Pipeline Monitoring Tools
Data pipeline monitoring tools transform data infrastructure from a potential source of business risk into a competitive advantage.
These tools will guarantee data reliability, accuracy, and timeliness and, therefore, allow organizations to make confident decisions based on reliable information.
Pipeline monitoring now looks more like full data observability.
This shift means that tools aren’t limited to notifying you when something breaks. Instead, they also provide context by explaining why it broke, what is impacted, and how to fix it.
Data observability allows you to understand your data's health, performance, and business impact across its entire lifecycle.
Data pipeline monitoring includes several advanced capabilities.
One is automated discovery, where tools automatically catalog data assets and map relationships and dependencies without the need for manual documentation.
These tools also include intelligent alerts with auto-prioritization.
Rather than flooding your inbox with notification noise, these systems use machine learning to surface genuinely anomalous behavior and even predict issues before they arise, allowing you to act proactively.
Root cause analysis across systems is also a major advancement.
When failures occur, observability tools help teams pinpoint underlying causes quickly, reducing mean time to resolution (MTTR) and helping prevent repeated incidents.
Finally, business-aware dashboards join technical monitoring and business value.
These dashboards tie metrics to business outcomes, which will help you prioritize issues based on technical severity and their impact to operations and strategy.
Features in Data Pipeline Monitoring Tools
When choosing your data pipeline monitoring tool, there are some features you should not miss out on, including:
- Data quality monitoring
Continuous assessment of data accuracy, completeness, and consistency.
For example, monitoring customer data to ensure email addresses follow valid formats and phone numbers contain the correct number of digits.
- Schema evolution tracking
Automated detection when data structures change, with impact analysis showing which downstream processes might be affected.
- Lineage visualization
Interactive maps showing how data flows through your organization, making it easier to understand dependencies and trace issues to their source.
- Performance optimization
Identification of bottlenecks and resource constraints that affect pipeline performance, with recommendations for improvement.
- Collaboration features
Tools that enable data teams, business analysts, and executives to share insights and coordinate responses to data issues.
Keep Your Pipelines Healthy with Sifflet
Pipeline issues don’t just slow down data teams, they disrupt customer experiences, delay reporting, and erode trust across the business.
Reactive firefighting is costly and proactive monitoring is a competitive advantage.
That’s where Sifflet comes in!
Our business-aware observability platform goes beyond surface-level alerts to provide end-to-end visibility, root cause analysis, and impact assessment, so you know what broke, why, and what matters most.
With Sifflet, data teams can:
- Detect and resolve issues before they reach stakeholders
- Prioritize fixes based on business impact, not just technical severity
- Scale operations with confidence, without scaling chaos
In today’s data-driven world, data pipeline health is business health. Let Sifflet help you stay ahead.
Contact us to see how data observability can power smarter decisions at scale.


-p-500.png)
