


Pipelines are the beating heart of your data ecosystem. When they fail, everything downstream, from dashboards to machine learning models, gets shaky. Until now, you probably had to bounce between Airflow, your catalog, and Slack threads just to figure out what went wrong.
That cycle is exhausting. We’ve felt it too.
That’s why we rebuilt our Airflow integration from the ground up: to give you the whole picture in one place. From orchestration to consumption, you can finally see how your data flows, whether it’s healthy, and who depends on it.
Why this matters
- For data leaders: Less blind trust, more visibility. You’ll know not just that data is broken, but why, and how to prevent it next time.
- For engineers: No more firefighting in the dark. Debug faster, get to root causes in minutes instead of hours, and spend more energy on building.
- For analysts and business users: Confidence. When a number looks off, you’ll see the pipeline behind it and know if it’s fresh or delayed.
What’s new in the integration
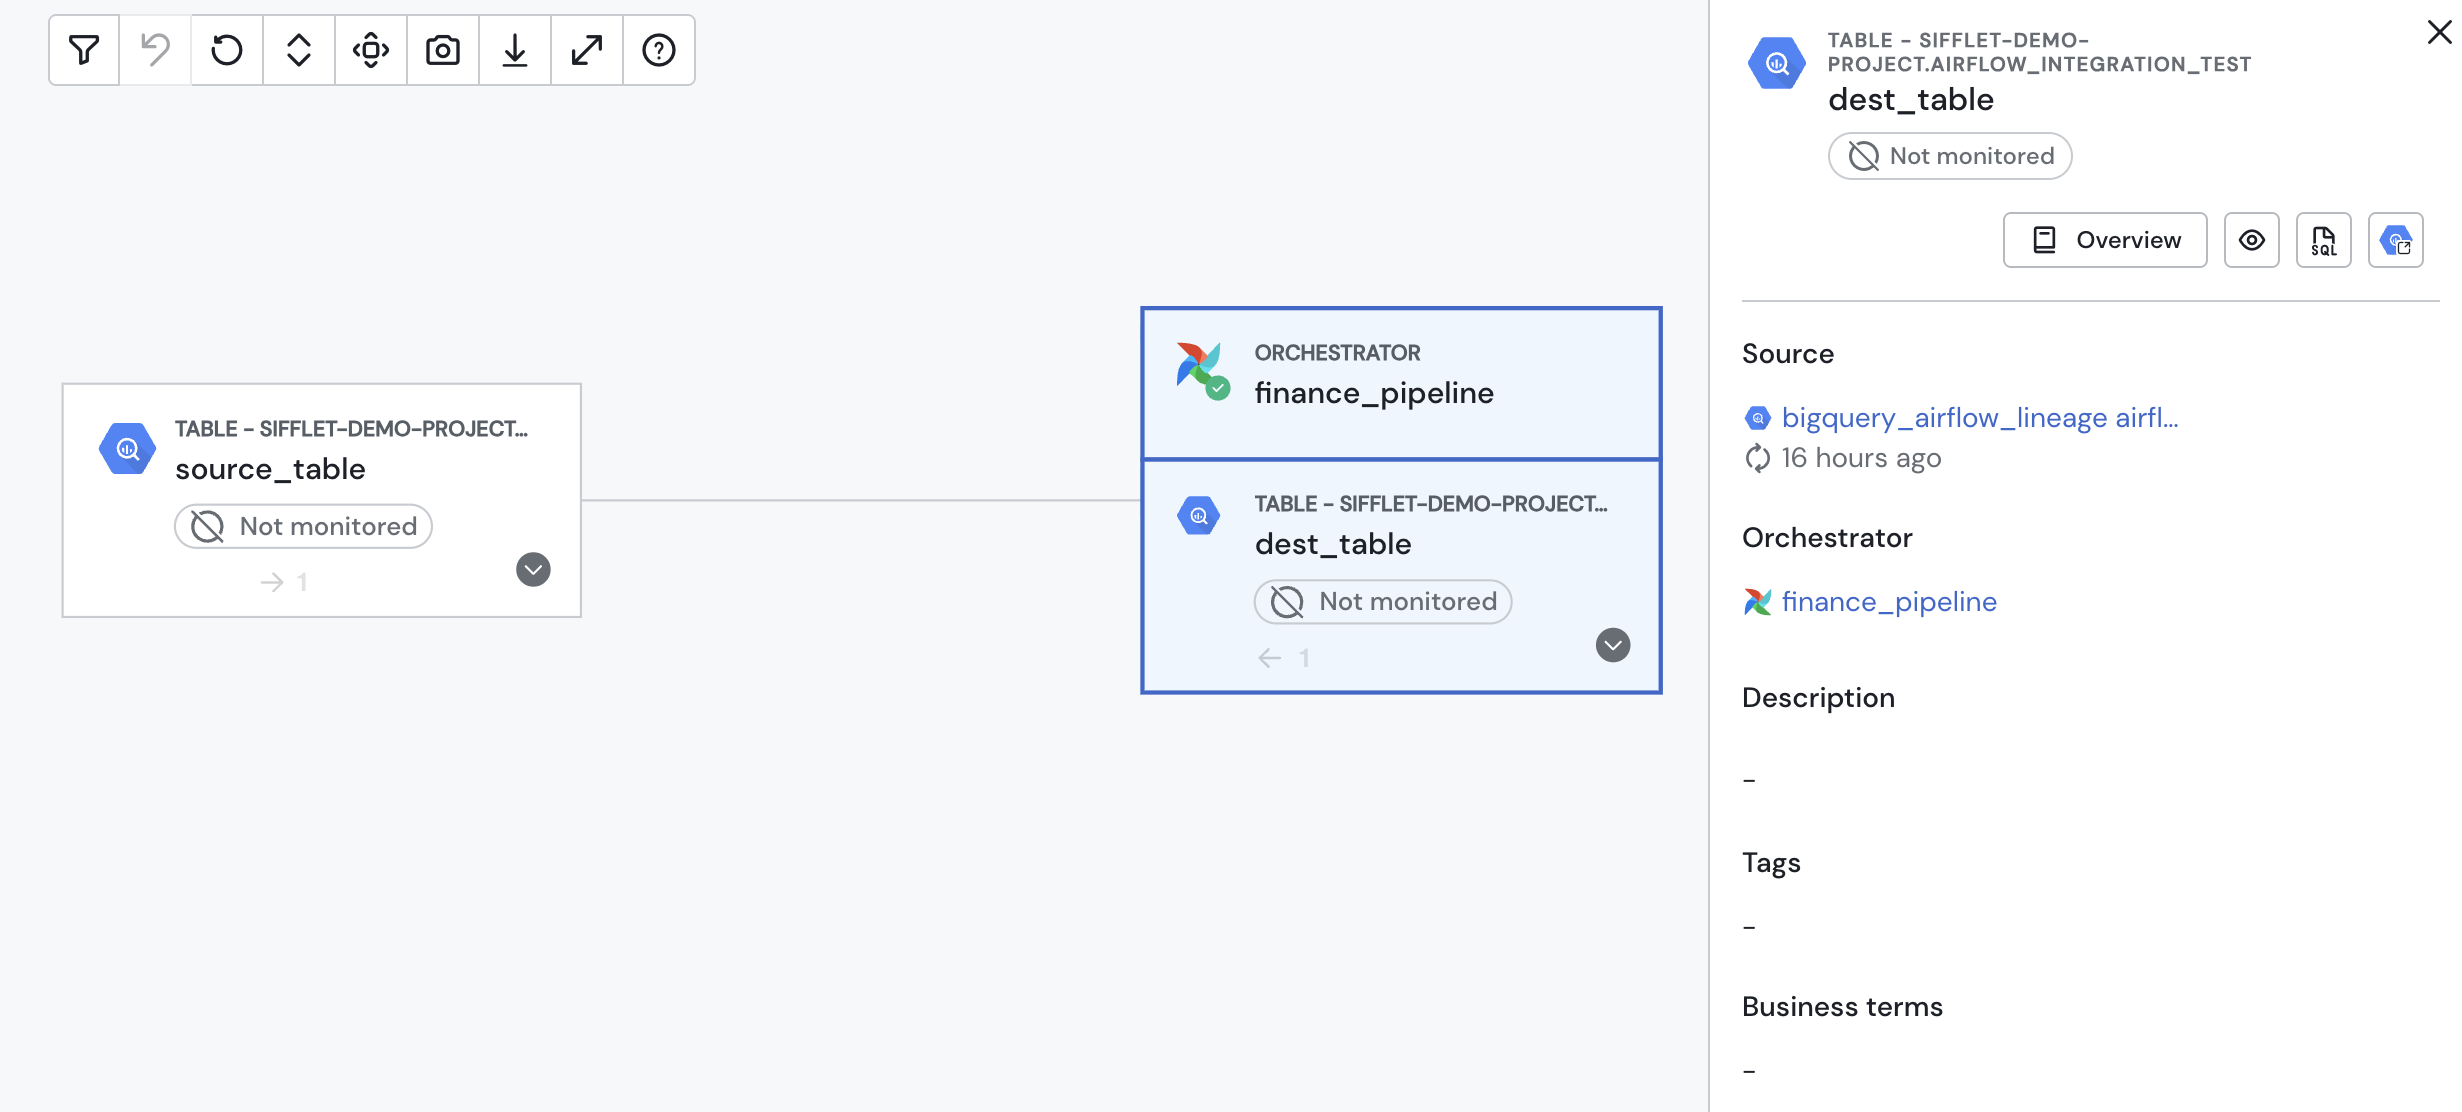
- Airflow DAGs in your lineage
Every table and view now carries its pipeline “birth certificate.” You’ll instantly see which DAG generated it. - Live DAG status in Sifflet
Skip the context-switching. Latest run status appears directly in your catalog and lineage view. - Pipeline context on asset pages
Open an asset, and its DAG, owners, and run health are right there with it. No more hunting.
What’s next
We’re already working on:
- Smarter root cause analysis: our AI agent Sage will flag failing DAGs as the likely cause of incidents.
- Task-level visibility: drill down to the specific task that failed.
- Broader orchestrator support: Databricks Workflows and Azure Data Factory are on the way.
Ready to try it?
We’re excited about this because it’s a real step toward data observability that works the way you do. Check out the docs, add a simple query tag to your operators, and start seeing Airflow as part of your data story, not a separate system you have to chase down.

%2520copy%2520(3).avif)


-p-500.png)
