


Databricks builds your data platform block by block.
With this data platform you can build a safe place for your data to flow from ingestion to consumption, including monitoring tools.
However, what happens when plain monitoring is not enough to keep your data safe, accurate, and reliable?
Enter: Data observability.
What Is Databricks?
Databricks is a dynamic cloud-agnostic platform used to build, manage, and scale everything from data pipelines to AI models, all within a single environment.
It brings together the best of data lakes and data warehouses in what’s dubbed a Lakehouse Architecture. That means you can store massive volumes of raw data, run fast SQL queries, train machine learning models, and share insights without switching tools or systems. Databricks can be deployed on AWS, Azure, and GCP, supporting customers with multi-cloud, hybrid, or migration needs.
The platform uses generative AI to help data scientists, analysts, and non-technical business users more easily understand their data and build data-driven applications, analytics workflows, and AI solutions.
Users can also connect to third-party observability, governance, and AI platforms from within Databricks with minimal configuration.
From natural language interfaces to intelligent data discovery, Databricks makes advanced analytics accessible for technical and business users alike. Its flexible design also inspires live collaboration between teams and platforms via secure, cross-cloud data sharing without replication.
Typical use cases include:
- Batch and streaming pipeline development
- BI delivery through tools like Power BI and Tableau
- Model development, training, and deployment
- Data product development (e.g., personalization, fraud detection)
- Governance and access control via Unity Catalog
Databricks supports everything from designing quick prototypes to building full-scale enterprise platforms.
But with each project moving into production, its complexity inevitably grows. It becomes harder to spot and manage data quality issues, to understand their impact, and keep workflows running cleanly across the stack.
The platform does include native tools to track system activity, job performance, and platform usage. They provide critical signals, but only within the Databricks environment itself.
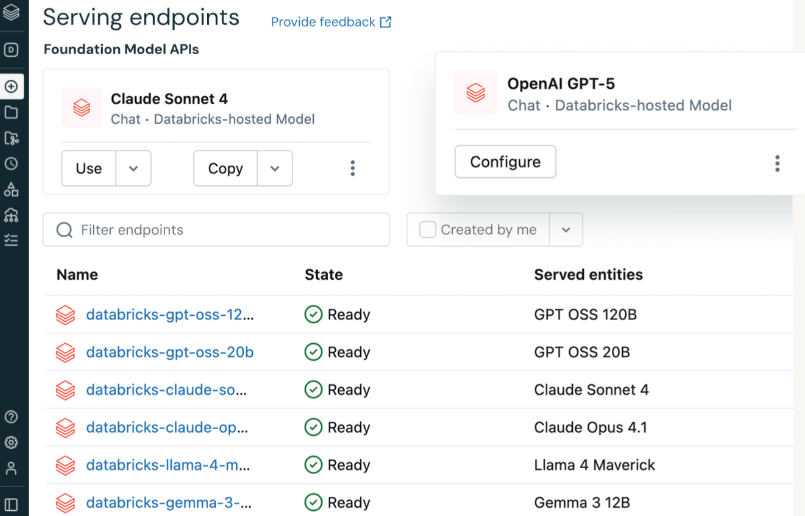
Monitoring Within Databricks
Databricks surfaces plenty of signals from within the platform through a variety of basic, everyday operational tools.
The most widely used signals in Databricks monitoring provide visibility into system performance and operational health.
Audit and cluster logs capture user activity, job execution events, error messages, and resource consumption, allowing platform engineers to diagnose performance drops and trace system-level failures.
Event logs and APIs record detailed information about job, cluster, and workspace events, supporting auditing and troubleshooting activities.
SQL performance dashboards visualize metrics such as job durations, query throughput, and Spark execution details, helping teams identify performance regressions and fine-tune resource allocations.
SQL alerts and integrations trigger notifications for conditions like failed jobs or long-running queries, with the ability to route alerts to incident response platforms for faster triage and resolution.
Together, these tools offer detailed insights into how Databricks is performing from a technical standpoint. However, they focus primarily on execution and infrastructure, not on the data itself, they can confirm that a pipeline ran successfully, but not whether the resulting data is complete, accurate, or usable.
Why Monitoring Isn’t Enough
Was the failure upstream? Which metrics and processes were affected downstream?
Monitoring tools can’t answer these questions.
Databricks tracks infrastructure and system performance, not data reliability. A pipeline can run without error while quietly passing through stale values, drifted schemas, or malformed rows.
These are the gaps observability was designed to close.
- Flawed forecasts
A typical scenario: A scheduled pipeline runs on time with no errors. But upstream, a numeric input quietly switches to a string. The logic executes, but the product forecasts it powers are now compromised. Days pass before analysts flag the issue.
From the platform’s perspective, nothing went wrong. Yet, the data is flawed, and so are the forecasts drawn from it.
- Unprioritized alerts
Even when alerts are received, they're unaccompanied by any context as to their severity. A staging-table failure flags the same way as a critical production job does.
Observability ranks these signals according to their impact on their downstream dependencies. It directs attention to the issues that affect an enterprise's most essential processes first, cutting through the noise of stacked alerts.
- Manual triage and investigation
Without observability, there's little help tracing issues to their source. Diagnosing problems means sifting through logs, notebooks, and dashboards manually, piecing together what broke, where, and why.
For example, an analyst updates a notebook to filter out low-volume SKUs. Everything runs fine, but soon after, the sales forecast unexpectedly drops and inventory begins to run short. It could take days to trace the change without observability in place.
That’s why McKinsey calls observability vital for cloud-ready enterprises to “reduce downtime and disruptions” and give teams “increased visibility and control.”
In Databricks environments, monitoring plays an important role. But it can't work properly without data observability.
Benefits of Implementing Observability
Observability links data's behavior to its impact on critical metrics and business outcomes downstream.
It delivers:
- Early detection
Flagging schema drift, freshness delays, and data anomalies before they reach dashboards or impact sensitive AI models. Small issues stay small.
- Business context
Every alert carries ownership, lineage, and usage metadata showing exactly where issues start, what they affect, and who needs to act.
- Faster triage
With system telemetry, lineage, catalog metadata, and quality signals in one view, observability supplies the clarity to act fast without backtracking through multiple tools.
- Root cause analysis
AI-assisted RCA traces issues through pipelines, notebooks, and tables. It shrinks triage from hours to minutes, freeing up valuable human resources and focus on higher-value work.
That's how observability shifts data teams from firefighting to system-building: by making Databricks environments even easier to manage and trust.
Next: what it takes to get there.
The Best Databricks Observability Integrations
Databricks does offer two tools that provide visibility over its environment. System Tables and Overwatch.
Databricks exposes internal telemetry as native system tables that analyze job history, resource usage, and cost trends through SQL. System Tables illuminate usage patterns platform teams can use to identify anomalies and optimize system performance.
Overwatch is an open-source observability tool developed by Databricks to enhance platform visibility. It consolidates audit logs, cluster configurations, notebook usage, and job execution data into curated tables and dashboards. While it requires manual setup, Overwatch provides deeper insight into system performance and cost trends.
Each tool has its strengths. However, both focus on infrastructure signals, not data reliability or its downstream impact. They surface what happened, not why or what to do next.
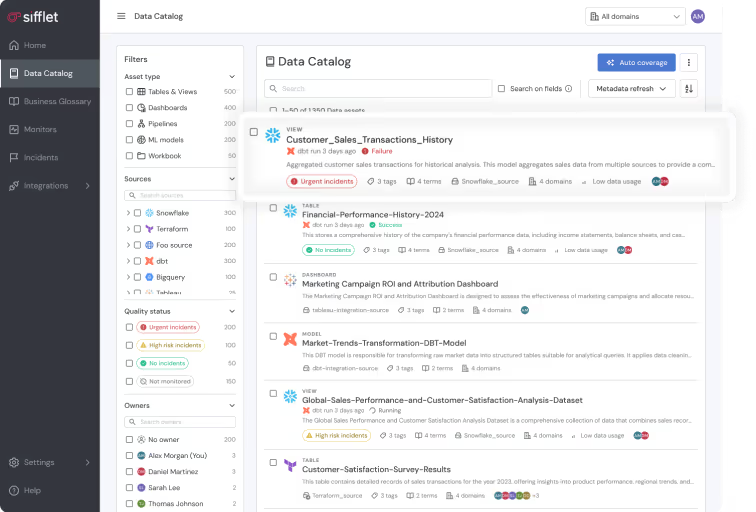
Sifflet delivers those answers, and more.
How to Use Databricks
Databricks offers a flexible and powerful environment for building data pipelines, running models, and delivering analytics at scale.
Here’s a high-level walkthrough of how most teams use Databricks in production:
Step 1. Design a workspace or cluster
Start by launching a Databricks workspace and configuring a compute cluster.
You can choose between standard or serverless options based on the expected workload and cost constraints. Existing clusters can also be reused for recurring jobs or collaborative development.
Step 2. Ingest raw data
Connect to your data from cloud storage platforms like S3, ADLS, or GCS.
Databricks also supports ingestion from on-prem systems and APIs. Most store this data in open formats like Parquet or Delta Lake for maximum efficiency and version control.
Step 3. Create and organize tasks
Use notebooks, SQL queries, Python scripts, or Delta Live Tables to define the logic for each stage of your pipeline.
Each task performs a specific function, such as transforming data, training a model, or refreshing a reporting table.
Step 4. Set dependencies and schedule Lakeflow Jobs
Group tasks into Lakeflow Jobs and define the order they should run using task dependencies.
You can schedule Lakeflow Jobs to execute automatically based on time triggers, events, or the successful completion of previous tasks. This makes complex pipelines repeatable and resilient.
Step 5. Register tables and models in Unity Catalog
Once your data is prepared, register tables, views, and machine learning models in Unity Catalog.
This allows you to manage access, track lineage, and enforce governance policies across projects and users.
Step 6. Serve analytics and data products
Transformed data can now be delivered to BI tools like Power BI, Looker, or Tableau, or served through APIs, dashboards, and ML model endpoints.
Step 7. Monitor and maintain
Monitor job performance, review resource usage, and check for data issues using built-in logs, dashboards, and system tables.
Alerts can be configured to detect failures, anomalies, or operational drift early before they affect downstream processes..
How Sifflet Integrates with Databricks
Sifflet connects to Databricks using secure API and SQL integrations. There’s no need to modify pipelines or write custom code. Setup is fast, lightweight, and fully aligns with your existing data governance controls.
Sifflet's native integration spans every layer of your Databricks environment, with no code changes required:
- Delta Pipelines and DLT: Sifflet monitors both batch and streaming workflows, including Delta Live Tables. It ingests real-time metadata and output states to track data movement and transformation.
- Notebooks, SQL, and ML Models: Sifflet maps code logic to outcomes, tracing data from notebooks and queries to the models, dashboards, or datasets they generate.
- Unity Catalog: Metadata around ownership, classifications, and access policies is captured and layered into alerts, enabling governance-aware incident response.
- Audit Logs and Execution Telemetry: Platform activity, such as job failures, performance changes, and cost anomalies, is pulled directly from native telemetry for deeper operational awareness.
- System Tables, Streaming APIs, and Workflows: Sifflet also connects to Databricks system tables, streaming interfaces, and workflow configurations to enhance coverage and surface more actionable signals.
Once active, Sifflet folds Databricks telemetry into a complete observability workflow, correlating it with lineage, quality signals, and infusing business impact for clear, confident visibility across your stack.
Why Sifflet Is the Best Observability Platform for Databricks
Sifflet enriches every signal with context, ownership, and impact.
Raw telemetry becomes a clear, prioritized view of system and data health, from ingestion to insight.
What that delivers in real terms:
- Catch what monitoring misses: Detect silent failures like schema drift, null spikes, and malformed inputs before they affect models or decision-making.
- Map lineage across the full stack: Trace every data flow, from Databricks to dbt, Airflow, and BI tools, with visibility that spans pipelines, queries, and dashboards.
- Send the right alerts to the right owners: Use governance context and usage signals to route issues directly to the teams responsible, without complicated handoffs or investigation delays.
- Prioritize by business impact: Know what matters. Incidents are ranked based on the downstream consequences, whether they threaten KPIs, executive dashboards, or customer-facing analytics.
That’s how Sifflet turns Databricks from a high-powered engine into a trusted, fully observable data platform ready for enterprise scale.
No custom workarounds. No patchwork tools. Just clear, actionable insight from ingestion to impact.
If you’re scaling Databricks, Sifflet brings the visibility and trust that monitoring can’t.


-p-500.png)
