


Splunk Observability Cloud helped define enterprise monitoring. But today's data landscape is something else entirely. AI, real-time data processing, and widely distributed systems have completely changed the game.
That’s why AI-native platforms like Sifflet, have entered the market and are redefining data observability in this age of AI.
Has Splunk kept pace?
Let's find out.
What Is Splunk Observability Cloud and How Does It Work?
Splunk Observability Cloud is an enterprise-grade platform for monitoring performance, quality, and security. An early pioneer of observability, Splunk delivers real-time visibility for troubleshooting data issues across your stack.
The platform supports both hybrid and cloud-native environments, and can manage high volumes of system and application telemetry.
Splunk decentralizes observability, placing insights directly into the hands of those closest to their systems. Engineers can build dashboards, set alerts, and explore their data without reliance on central platform teams.
That self-service approach is balanced by safeguards, including role-based access controls, curated templates, and standardized configurations to preserve consistency and governance standards.
Splunk excels in monitoring; however, it lacks a data catalog and other crucial technologies in observability.

Features in the Splunk Observability Cloud
Splunk's modular observability suite brings system health, performance, and troubleshooting into focus over complex environments.
Front and center, Splunk Observability Cloud equips engineers and operations leaders with real-time visibility across infrastructure, applications, and user experiences. Built on OpenTelemetry standards, the platform ingests and correlates logs, metrics, traces, and user telemetry to assemble a unified view of system performance. This correlation is automatic; patterns and issues can be identified without manually cross-referencing data.
Self Exploration
The platform's interface encourages self-exploration. Interactive, configurable dashboards let users filter by service, environment, or time range and pivot from high-level service health indicators down to granular traces and log lines with just a few clicks. Users can tailor charts and graphs to highlight the metrics that matter most to them.
Splunk also supports custom detectors: rules that monitor for specific conditions in system performance, such as unexpected latency spikes, error rates, or throughput drops. These detectors can be tuned to reflect business-specific thresholds or SLAs, to catch and prioritize anomalies before they escalate.
Splunk IT Service Intelligence (ITSI) acts as the command center for service health. Rather than present isolated alerts, it correlates signals across infrastructure, applications, and business services into unified episodes that describe which alerts matter and why.
User Designed Health Metrics
Users define their own healthy service status by assigning key performance indicators (KPIs), thresholds, and dependencies. ITSI then scores each service in real time to offer a continuous read on performance and risk.
Interactive executive dashboards that Splunk refers to as Glass Tables bring these scores to life. They map system relationships, alert to early signs of degradation, and provide leadership with a business-context view of technical performance.
Another feature of ITSI is the use of adaptive thresholding to differentiate between and understand historical patterns from traffic spikes or seasonal patterns to lessen noise and wasted effort from false positives.
Overall, ITSI is a strategic tool for managing service health, prioritizing incidents, and aligning technical signals with business impact.
Splunk AppDynamics delivers deep application performance monitoring across hybrid, legacy, and multi-tier systems. Purpose-built for production environments, it traces requests end-to-end through services, APIs, databases, and infrastructure to pinpoint exactly where latency or failures occur.
Full Business Context
Unlike limited APM tools, AppDynamics maps out business transactions in full. Users see how individual lines of code execute, in context, and how upstream changes cascade across the stack. Combined with customizable dashboards, this offers insights to those managing mission-critical applications for rapid incident response and root cause analysis.
By providing this level of depth and visibility, AppDynamics helps optimize code, validate releases, and maintain a reliable digital experience without the need for painstaking reconstruction from scattered logs.
Additional Features
Splunk's observability tools and capabilities offer several crucial advantages for managing system health and performance at scale.
- Alert noise reduction
Splunk IT Service Intelligence reduces alert fatigue by grouping related alerts into "episodes." Each episode combines multiple events that point to a single underlying issue across systems and services.
- AI & ML enhancements
Applying artificial intelligence throughout its observability suite, Splunk expedites investigations and minimizes downtime. The AI Assistant analyzes data to highlight likely root causes, helps identify affected systems, and suggests next steps.
Splunk's predictive capabilities add a proactive edge. Trend modeling, anomaly scoring, and dynamic baselines aid early detection of deterioration in system performance.
- Infrastructure monitoring
Splunk provides real-time visibility across the entire technology stack, from cloud services and infrastructure to the end-user experience.
It combines system performance, digital experience data, and service dependencies in a single view to identify issues before they disrupt business outcomes.
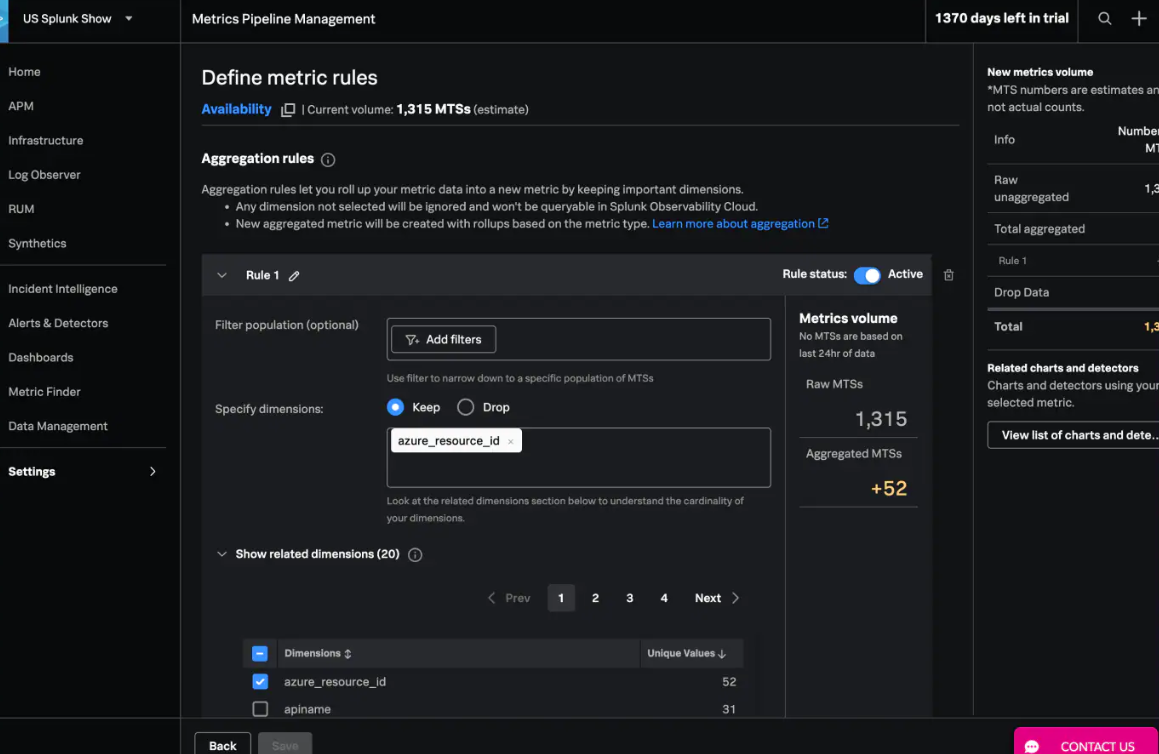
With Splunk, you can define the metrics you want to track so you can focus your monitors and not scale your bill.
- AI Assistant
Splunk’s AI Assistant automates your observability and combines natural language processing with AI.
It allows you to interact in plain English, streamlining investigations and enabling both technical and non-technical roles to make use of Splunk data.
Key features include automated root cause analysis across Splunk APM, Infrastructure Monitoring, and Log Observer; in-context troubleshooting with step-by-step guidance; and the generation of SignalFlow code for building charts and detectors.
Additionally, it provides suggested actions to optimize workflows by using Agentic AI frameworks to deliver faster, more accurate answers.

Who Should Use Splunk Observability Cloud?
Splunk Observability Cloud best suits large enterprises with complex, distributed infrastructure and high volumes of telemetry data.
This platform serves mature DevOps and Engineering teams who need real-time visibility into hybrid or multi-cloud architectures.
When Isn’t Splunk the Right Fit?
Splunk may overwhelm smaller, budget-conscious organizations or those focused more on data quality than system metrics. Its complexity, configuration requirements, and ingestion-based pricing can quickly stretch limited resources.
In the right environment, Splunk offers many capabilities supporting visibility, reliability, and sheer scale for observability.
Here's what it brings to the table.
Splunk Observability Cloud Reviews: What Real Users Say
Commentary on Gartner Peer Insights offers good grades for Splunk's visibility, customization, and diagnostic capabilities.
Reviewers praise its search capabilities and indexing engine, noting how SPL enables fast queries across massive log volumes.
Custom dashboards, flexible alerting, and tailored analytics pipelines are also frequently cited as core strengths.
Stability and reliability also stand out. Reviewers describe how using Splunk aided incident investigations and improved capacity planning. Mobile access and role-specific alerting are also seen as adding good value.
Common Pain Points in Splunk Observability User Reviews
Yet, issues concerning its performance appear across several reviews. Users cite slow query speeds at high volumes, delays in log parsing, and lag during system recovery.
Splunk's onboarding process also draws criticism, noting steep learning curves and limited documentation to explain advanced features.
Unanticipated high costs are another recurring theme. Multiple reviewers shared that Splunk grew prohibitively expensive in event-heavy workloads or large-scale deployments. They lamented that pricing rapidly increased with growing ingestion volumes.
These reviews only underscore what we've already noted: Splunk is geared for large-scale enterprises with the budget and resources to support the platform's cost, setup, and maintenance demands.
Next up: the benefits and trade-offs of using Splunk Observability Cloud.
Pros and Cons of Splunk Observability Cloud
Like any enterprise platform, Splunk Observability Cloud delivers clear advantages, but not without its limitations that may affect adoption, cost, or usability. Below, we outline where Splunk excels and where it might fall short.
✔️ Pros
1. Unified, full-stack visibility
System data, user activity, and performance signals are merged into a single platform for visibility. This consolidated view streamlines end-to-end monitoring of data operations in dynamic environments.
2. Customizable and flexible
Splunk adapts to how your organization works. Individual users can tailor dashboards, alerts, and monitoring rules to match specific business goals, service-level expectations, and other internal processes.
3. Solid out-of-the-box capabilities
Prebuilt dashboards and monitors for common systems and workloads are included and ready for immediate use. These templates speed onboarding and shorten platform time to value.
4. External API and integration observability
Splunk monitors third-party services by tracking requests, responses, and latency across external APIs to identify integration issues before they impact performance.
5. Stability and performance
Splunk delivers consistent performance in large, complex environments. With proper setup, it manages high data volumes and maintains reliability during traffic spikes.
✖️ Cons
1. High total cost of ownership
Per-host pricing offers flexibility, but costs rise quickly as more features and data are added. In large or complex environments, total spend can increase significantly.
For organizations focused on cost control or lean operations, unexpected costs, extensive setup requirements, and the need for ongoing tuning present barriers to entry.
2. Steep learning curve
Splunk's power comes with complexity. Tasks like writing SPL queries (Splunk's proprietary query language) and modeling services often require specialized expertise.
For lean teams, this can slow adoption, increase reliance on niche roles, and delay time to value.
3. Significant configuration overhead
Prebuilt templates provide out-of-the-box support, but real-world environments typically require considerable customization. Organizations often spend months fine-tuning alerts, thresholds, and service models before the platform reaches full operational value.
4. Performance issues when scaling
Although designed to scale, Splunk's performance drops off without ongoing, meticulous configuration. Large log volumes or wide queries may result in slow searches, delayed alerts, and dashboard lag in under-optimized environments.
5. Too much complexity for modest use cases
Splunk is more solution than needed for simpler needs, such as basic dashboards or lightweight monitoring. Its depth and complexity can present delays and increased costs when speed and simplicity are the main priorities.
Splunk Observability Cloud is robust but not a one-size-fits-all solution. Its cost and complexity likely outweigh the benefits in leaner or fast-moving settings.
So that begs the question:
Is Splunk Observability Cloud the Right Observability Platform for You?
It's a good fit for organizations that:
- Run high-volume systems across hybrid or multi-cloud infrastructure
- Have the technical expertise to configure and maintain custom dashboards, queries, and alerting
- Already use other Splunk products and want a unified observability platform
But it's not ideal for those who:
- Require rapid deployment with low setup and maintenance overhead
- Prioritize predictable, transparent pricing as data volumes grow
- Focus on data quality, early anomaly detection, and accountability tied to business performance over system-level metrics
- Operate with lean teams or prefer low-code observability platforms that are easier to manage
But how does Splunk match up against Sifflet?
Splunk Observability vs. Sifflet Observability
The reality is: Splunk is powerful but heavy.
Steep learning curves. Long setup cycles. And rapidly rising costs as systems grow.
Conversely, Sifflet is AI-Native and built for agile data reliability.
Sifflet deploys quickly, adapts easily, and quickly spots and helps solve data quality issues before they escalate.
Even better, there's no proprietary query language to wrangle with, and no multi-month configuration cycle to wait on. Many deployments are up and running in days.
Sifflet is best for modern data stacks that demand trust, speed, and accountability.
It detects schema drift, surveys freshness, and employs field-level lineage to trace and identify data issues that threaten your most critical business metrics, processes, and outcomes. Sifflet embeds trust scores directly into workflows, so business and technical teams can spot problems early, before they can cause real harm.
Behind Sifflet's intelligence are three AI agents:
- Sentinel detects anomalies in schema, freshness, volume, and values, and prioritizes them based on their impact downstream
- Sage traces and identifies root causes, connecting them to both technical systems and business outcomes.
- Forge guides successful resolution with recommended fixes, workflow automations, and contextual playbooks.
Sifflet's agents make data observability proactive, scalable, and accessible from inside the platform. Not just bolted on.
Book a Demo: Sifflet's AI-Native Observability in Action
Sifflet is data observability for how modern data stacks work and the most vital business outcomes that depend on them.
Book a demo to see how Sifflet shifts your team from reactive firefighting to proactive trust.


-p-500.png)
