


Did you know choosing the right data observability platform can reduce issue investigation by up to 70%?
In other words, your data reliablity and freshness relies in data observability.
In 2026, the top data observability platforms will be the cornerstone of your data protection.
The goal of data observability is not limited to standing guard over your catalogs, it takes a more proactive approach using AI to suggest monitors, learn from your catalogs and provide fast problem resolution.
What is Data Observability?
Data observability is the always-on, “overseeing layer” that sits above your entire data platform.
It should continuously collect technical signals and business-usage context so that you can detect, triage, and resolve issues before they hurt revenue, decisions, or AI models downstream.
First-generation data observability vendors were built to watch technical signals and telemetry, such as data quality, freshness, volume, schema changes, and lineage.
The problem was that these tools don’t really check impact analysis or usage insights.
However, some vendors have included these features as add-ons, meaning, it is not an actual part of the product.
In other words, if a tool doesn’t have business context woven directly into its alerting logic, it will stop at the technical layer, rendering notifications worthless.
Real trust and faster resolution, though, comes only when business context sits side-by-side with pipeline metrics in the observability engine.
Open Source vs. Commercial Data Observability
There a two types of data observability tools:
Open-source tools like Soda Core and Great Expectations are primarily designed for rule-based data quality validation.
They allow data teams to define explicit checks (for example, null thresholds or accepted value ranges) that run inside pipelines or CI/CD workflows.
This makes them well suited for engineering-led teams that want full control and are comfortable maintaining data quality as code.
However, open-source approaches require manual configuration and ongoing maintenance. Every rule must be written, updated, and versioned by data engineers.
Open-source tools also provide limited lineage, so when an issue is detected, teams still need to manually investigate which dashboards, models, or business processes are affected.
Commercial platforms like Sifflet and Monte Carlo are built for constant data reliability.
Instead of relying solely on static rules, they use behavior-based anomaly detection that learns normal data patterns and flags meaningful deviations automatically.
Commercial platforms also offer end-to-end lineage and automated root cause analysis, connecting data issues across ingestion, transformation, and consumption layers. When something breaks, teams can immediately see what changed, where it propagated, and which stakeholders are impacted.
Commercial observability is best for:
- Scaling data teams
- Business-critical analytics and AI systems
- Executive visibility and accountability
- Reducing downtime and incident resolution time
To check the impact of data downtime for yourself, use this calculator and see the real cost of labor, compliance, and opportunity:
What Features Should a Data Observability Platforms Have?
Most data observability tools solve half the problem and call it done, however, a mature platform needs to walk you through the complete cycle:
- Monitor and detect
- Alert and triage
- Investigate
- Recommend
- Resolve and prevent
It’s not enough to just catch problems. You need to understand what broke, why it broke, and how to stop it from breaking again.
It’s not uncommon to see companies deploy three different monitoring tools because no single vendor covers all their domains.
To avoid this pain point, you should look for specific technologies (or features) from your data observability platform to help you detect, understand, and resolve issues before they become downstream problems.
Integrations
A data observability tool must integrate with the rest of your data platform, in particular, your data warehouse, transformation tools, ingestion layers and BI platforms in order to provide a unified view across your stack.
Look for tools that integrate with common components, such as:
- Date Warehouses: Snowflake, BigQuery, Redshift, Databricks, Azure Synapse
- Transformation Tools: dbt, Spark, Dataform, Fivetran Transformations, Matillion
- Ingestion Layers: Fivetran, Airbyte, Stitch, Kafka, AWS Kinesis, Azure Event Hubs, Segment
- BI Platforms: Looker, Tableau, Power BI, Mode, Hex, Metabse, Sisense
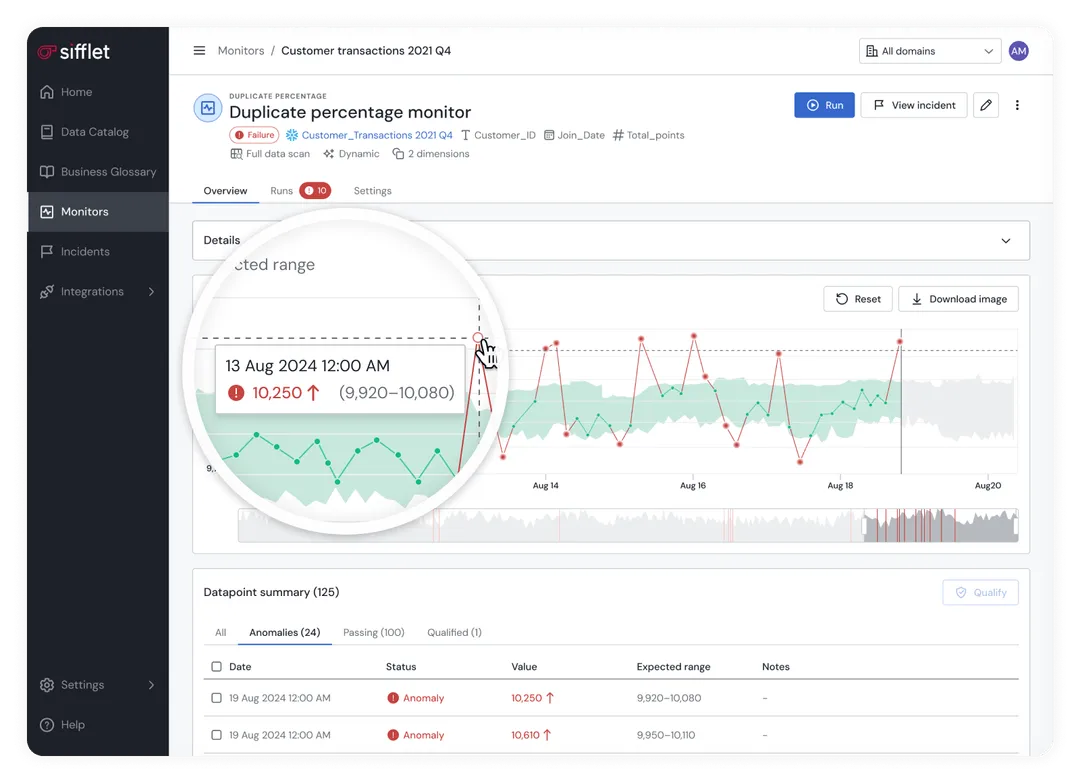
Data Quality Monitoring
Data quality monitoring must catch problems before they impact downstream data products and users.
Basic elements like null checks, schema validation, and volume anomalies are now table stakes. What separates good monitoring from noise is intelligent anomaly detection that learns your data patterns and flags genuine issues, not just a seasonal traffic spike.
Here’s a critical part, though: manual rule creation doesn’t scale.
As your platform scales from dozens to hundreds or even thousands of tables, it’s impossible for your data engineering team to hand-craft quality checks for every dataset.
Look for platforms that automatically discover and profile your data, then suggest quality rules based on observed patterns. The best systems will continuously learn and adapt your monitoring as your data evolves.
Effective, automated monitoring covers multiple dimensions, such as statistical outliers in numeric fields, unexpected categorical values, and business rule violations specific to domains. Intelligent platforms also auto-generate monitoring for new datasets and adjust thresholds based on historical patterns, while still allowing you to define custom quality rules that reflect your actual business logic, not just generic data patterns.
If your platform can’t automatically monitor 100 new tables added this month without requiring a data engineer to configure each one, you’ll hit a maintenance wall.
And if your monitoring generates more false positives than it signals real issues, people will ignore it. You need tools that balance automated coverage with practical signal-to-noise ratios.
Alerting
Smart alerting is about separating signal from noise.
You need the right people to get the right context at the right time, not 47 Slack notifications about a single pipeline failure.
An effective alerting system takes into account business context with an understanding of escalation paths to avoid alert fatigue.
For example, customer-facing dashboards should trigger immediate alerts to both data engineers and business stakeholders, whereas internal analytics that refresh nightly can wait until morning.
The very best platforms will offer multiple alert channels, such as email, Slack, webhooks or even PagerDuty, while letting you customize severity levels, notification timing, and recipient groups based on data asset importance and business impact.
What you’ll want to look for: intelligent alert routing, customizable severity levels, alert consolidation and integration with your existing incident management tools.
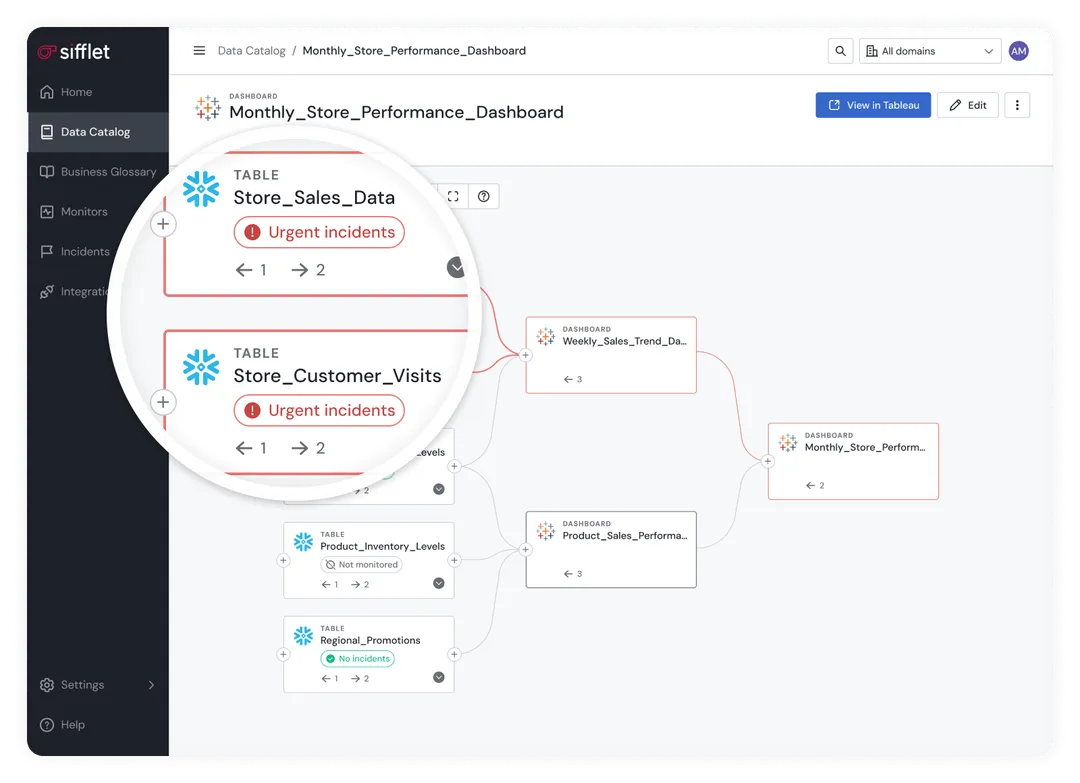
Data Lineage
When data breaks, data lineage helps you answer the question: “What else is affected?”
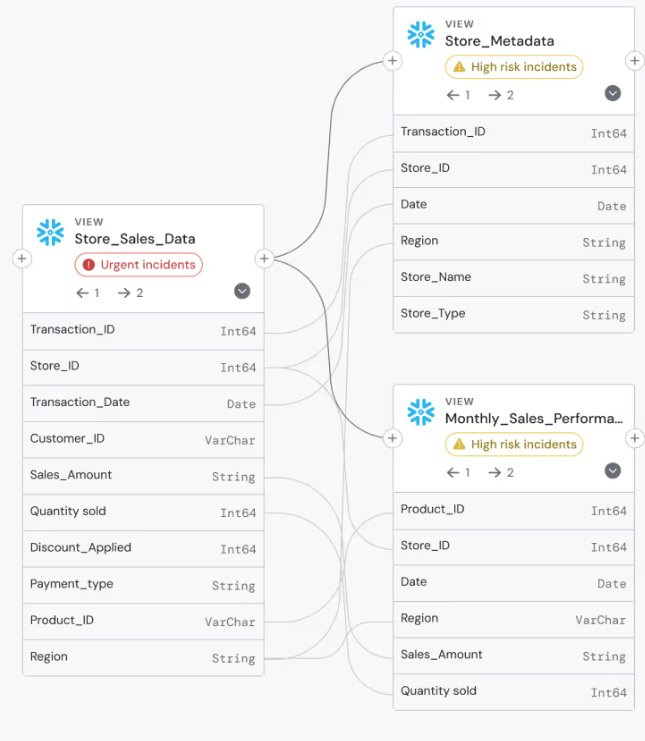
From source systems through transformations to final consumption in reports, applications, and models, comprehensive lineage tracking maps data flow. This is critical when you need to immediately understand what’s at risk (dashboards, models, business processes) in the event of a data change or break upstream.
A good lineage tool will give you both technical lineage (table-to-table dependencies) and business lineage (how data flows through business processes). The best ones also integrate with your transformation tools like dbt, orchestration platforms like Airflow, and BI tools like Looker to create end-to-end visibility.
The practical test: If a critical data source fails at 2 AM, can you quickly identify which business stakeholders need to be notified? That's what lineage is really for.
Root Cause Analysis
Detecting problems is easy. Understanding why and how they happened, and how to prevent them from reoccurring, is hard.
This is where data observability platforms prove their value.
Effective root cause analysis automatically correlates multiple signals to suggest probably causes, rather than leaving you to manually hunt through logs. These signals include data quality metrics, pipeline execution logs, infrastructure health, schema changes, and user behavior patterns.
To ensure you’re purchasing a platform with good RCA, look for features like automated impact analysis, change detection, anomaly correlation, and integration with your Git repositories to track code changes that might have triggered issues.
The best platforms will maintain historical context, so you can spot patterns across incidents.
The goal of RCA: Turn "the data is wrong" into "the upstream API changed its date format last Tuesday, affecting these three transformations and breaking customer segmentation logic."
Data Catalog
The goal of a data catalog is to facilitate data discovery and adoption.
Finding relevant datasets quickly and understanding what they contain is imperative for many teams across the org.
A modern data catalog goes above and beyond basic metadata storage, automatically documenting data assets, tracking usage patterns, surfacing popular datasets, and integrating with your existing workflow tools.
Top of the line catalogs will use machine learning to suggest relevant datasets and automatically maintain documentation as schemas evolve.
Some critical catalog features include search functionality that actually works, automated data profiling, business glossary integration, and the ability to see which datasets are actively used versus abandoned.
Governance features like data classification, access policies, and change notifications help maintain trust as your platform scales.
The reality: Catalogs succeed when they solve real discovery problems and fail when they become metadata homework that nobody maintains.
Why You Need a Data Observability Platform
Modern data stacks rely on many of the same technologies, aka, catalogs, lineage, monitoring, metadata, but data observability uses them to guarantee the reliability and operational health of your pipelines.
While governance tools use lineage for compliance and access control, and quality tools enforce predefined rules, observability platforms correlate signals across the entire stack to detect, prioritize, and explain issues before they impact the business.
A data observability tool matters because today’s dashboards, ML models, and operational systems break for reasons that traditional monitoring can’t see.
The benefits are clear: fewer data incidents, faster triage, and smarter prioritization based on business impact.
10 Best Data Observability Tools
Finding the best data observability platform to fit your needs can be a challenge, so lets break it down.
How Data Observability Pricing Works
Athough many tools don't disclose pricing or pricing models, it is important to understand how observability pricing models work. There are three main pricing models:
- Compute-based: Pay per query or processing
- Table-based: Pay per monitored dataset
- Usage-based: Scales with data footprint and activity
Be cautious of hidden costs related to alert volume, lineage depth, and historical retention.
1. Sifflet: Best for Full-Stack, Business-Aware Observability
Ratings ⭐⭐⭐⭐⭐
G2 4.7/5
What is Sifflet?
Sifflet is an end-to-end context-aware data observability platform. Sifflet avoids overwhelming altert fatigue by analyze context in anomaly detection.
Sifflet aims to unify data discovery, monitoring, and resolution into a single platform by prioritizing what matters to your business helping you understand not just what broke, but why it matters.
Three AI agents, Sentinel, Sage, and Forge go beyond detection in order to recommend monitoring, recall incident patterns, and suggest fixes grounded in historical behavior.
What makes Sifflet stand apart from the crowd, is the fact that it is built with business awareness in mind. Meaning that both technical and non technical users have access to data and are responsible for the quality.
Data leaders gain enterprise-level visibility across complex ecosystems, engineers get deep lineage and fast root-cause analysis, and analysts benefit from intuitive interfaces that explain data flows without needing to understand the underlying infrastructure.
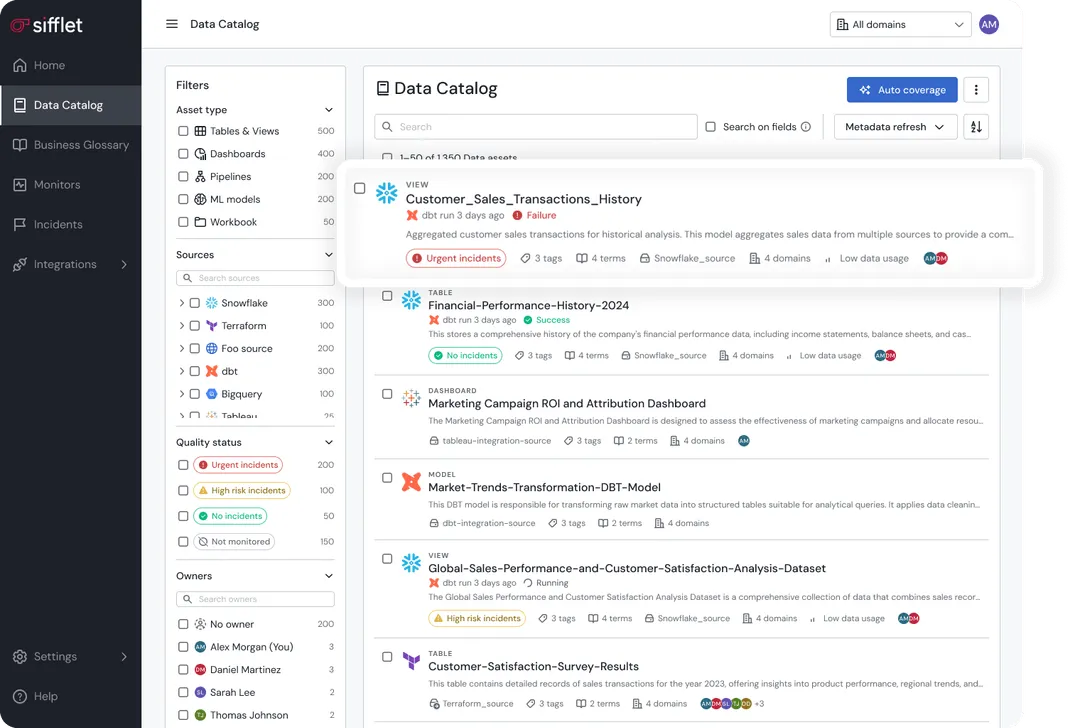
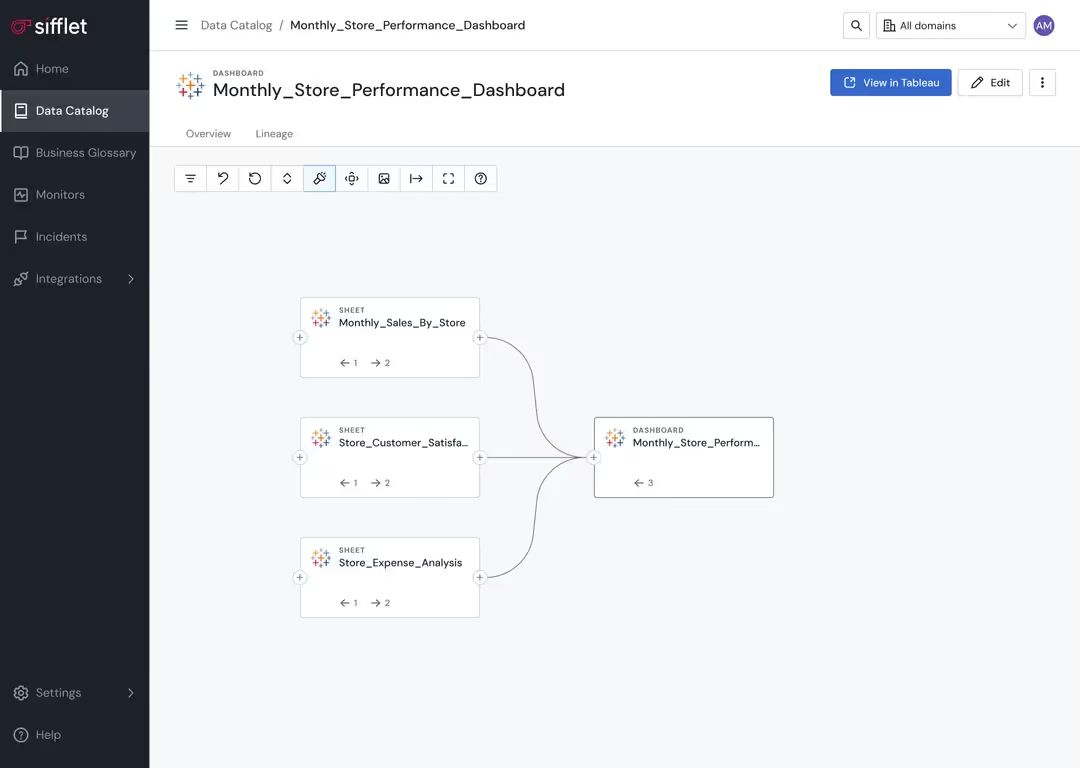
Sifflet has three core technologies: a data catalog, data monitoring, and data lineage, all enriched ith Sifflet’s native AI.
Pricing
Sifflet uses a tiered, usage-based pricing model designed to scale with your organization’s data maturity.
Pricing is primarily driven by the number of data assets you need to monitor, allowing you to start small and expand observability coverage as your data platform grows.
The Entry tier is designed for small but capable data teams getting started with observability.
It supports up to 500 monitored assets and includes core data observability capabilities such as freshness, volume, schema monitoring, a built-in data catalog, business-aware lineage, and automated root cause analysis.
The Growth tier targets cross-functional data teams that need broader coverage and stronger collaboration. It increases monitoring capacity to around 1,000 assets and adds features like AI-powered incident management, role-based access control, SSO, and the Data Observability Agent (Sentinel) for automated monitoring suggestions.
For large, regulated, or complex organizations, Sifflet offers an Enterprise tier with flexible asset limits, advanced governance features, and expanded deployment options, including SaaS, hybrid, or self-hosted environments. Enterprise customers receive 24/7 white-glove support, enterprise SLAs, and a dedicated onboarding and success program that may include executive sponsorship.
✅ What Sifflet is best for
- AI-powered automation
- Business-technical collaboration
- Smart alerting
- Modern data stacks
❌ Where Sifflet falls short
- Infrastructure monitoring
- Enterprise track record
- Hybrid environments
2. Monte Carlo: Best for Enterprise Data Reliability
Ratings ⭐⭐⭐⭐⭐
G2 4.4/5
What is Monte Carlo?
Monte Carlo positions itself as the pioneer and enterprise leader in data observability, focusing on data reliability and reducing downtime.
The platform was built around the idea that data teams need the same level of reliability engineering that software teams enjoy, including proactive monitoring, automated detection, and clear visibility into the health of their systems.
Monte Carlo offers automated anomaly detection powered by ML to learn data patterns and flag issues to surface unusual behaviors, end-to-end pipeline monitoring supported by automated lineage and field-level tracking, and enterprise-grade incident management with data quality scoring, alerting, and root-cause analysis.
Recently, Monte Carlo began their shift toward agentic observability, an approach that embeds AI agents directly into the data reliability workflow, similar to Sifflet’s.
Monte Carlo’s new troubleshooting and monitoring agents can ingest structured and unstructured data, interpret metadata across pipelines, and reason about the relationships between systems.
When an issue arises the agents step in.
They sift through lineage, review recent deployments, analyze schema changes, and correlate related incidents. The goal is to shift from reactive firefighting to proactive assistance, reducing the time data teams spend combing through logs, dashboards, and Slack messages to manually piece together what went wrong.
Pricing
Monte Carlo uses a usage-based pricing model centered on monitors, rather than seats or data volume.
You can choose pay-as-you-go pricing for flexibility or commit to usage in exchange for discounts and cost predictability, making the model adaptable for both fast-growing teams and large enterprises.
The Start tier is designed for a single data team establishing baseline data reliability. It includes monitoring for data warehouses, BI tools, and ETL pipelines, along with incident triaging, root cause analysis, lineage, and performance observability.
The Scale tier expands coverage across multiple teams, domains, and data architectures. Pricing continues to be per monitor, but user limits are removed, API capacity increases, and onboarding becomes expert-guided with stronger support SLAs.
For large enterprises, the Enterprise tier provides full end-to-end observability across complex and legacy environments, including enterprise data warehouses such as Oracle, SAP HANA, and Teradata.
Monte Carlo’s pricing emphasizes operational coverage and monitor volume, making costs closely tied to how extensively data reliability is enforced across the platform. This approach favors organizations with large, complex pipelines that want granular control over what is monitored, but it can become costlier as observability expands to thousands of assets and domains.
✅ What Monte Carlo is best for
- Enterprise-scale reliability
- Comprehensive detection
- Business impact prioritization
- Mature integrations
❌ Where Monte Carlo falls short
- Metadata intelligence
- Team collaboration
- Cost and flexibility
3. Anomalo: Best for Large-Scale Data Quality Automation
Ratings ⭐⭐⭐⭐
G2 4.5/5
What is Anomalo?
Anomalo is an AI-powered data quality monitoring platform that uses unsupervised machine learning to detect anomalies across enterprise data warehouses.
Instead of relying on predefined rules or thresholds, it learns the natural patterns of each table and flags deviations in volume, schema, or distribution.
This makes it suitable for large organizations with stable, mature data environments where writing and maintaining rules would be too time-consuming.
Its core strengths include fast setup, strong ML-based detection, and broad integration with tools like Snowflake, BigQuery, dbt, and Airflow.
The platform is most effective for enterprises with established data governance, clear data ownership, and teams equipped to respond to anomaly alerts. Because Anomalo’s defaults run once per day and the platform isn’t optimized for real-time or streaming pipelines, it performs best in analytical workloads rather than event-driven environments.
Anomalo also offers a three-tier monitoring system including low-cost metadata observability, AI-based anomaly detection, and custom validation rules.
The platform also monitors unstructured data as it has recently expanded to monitor documents, PDFs, and files for AI/GenAI use cases.
✅ What Anomalo is best for
- Large-scale automation
- AI-ready data quality
- Enterprise data volumes
- Cloud-native deployments
❌ Where Anomalo falls short
- Limited observability scope
- Weak business context
- Basic collaboration
- Consumption-zone focus
4. Acceldata: Best for Hybrid & Regulated Environments
Ratings ⭐⭐⭐⭐
G2 4.5/5
What is Acceldata?
Acceldata Data Observability Cloud (ADOC) is an agentic data management platform that combines data observability and reliability.
ADOC organizes observability across five key domains: pipelines, infrastructure, data quality, usage, and cost.
By blending telemetry with metadata, it identifies operational anomalies and funnels them into alerts, dashboards, and triage workflows. Its AI-driven approach helps debug complex environments like Snowflake pipelines or Kafka throughput issues, providing enterprises with comprehensive end-to-end visibility.
Its Agentic Data Management (ADM) adds AI-driven intelligence to monitor, trace, and solve issues autonomously.
ADM includes AI agents that profile data, track lineage, and detect anomalies while learning baseline behaviors to identify deviations. Users can interact through a natural-language interface, asking questions such as pipeline freshness or anomaly reports, and receive instant insights, recommendations, or automated responses.
Security and deployment options support enterprise needs, with SOC 2 Type 2 certification, multi-factor authentication, role-based access, encryption, and SSO integrations.
ADOC can run in cloud-native, on-prem, or hybrid environments, meeting regulatory requirements in finance, healthcare, and telecom. While governance features are improving under ADM, deeper policy enforcement, classification-driven controls, and full audit workflows may still require external systems.
✅ What Acceldata is best for
- Complete infrastructure visibility
- Enterprise hybrid environments
- FinOps and cost control
- Regulated industries
❌ Where Acceldata falls short
- Modern data stack focus
- User experience complexity
- Collaboration workflows
- Innovation speed
5. Bigeye: Best for Monitoring-as-Code Teams
Ratings ⭐⭐⭐⭐
G2 4.1/5
What is Bigeye?
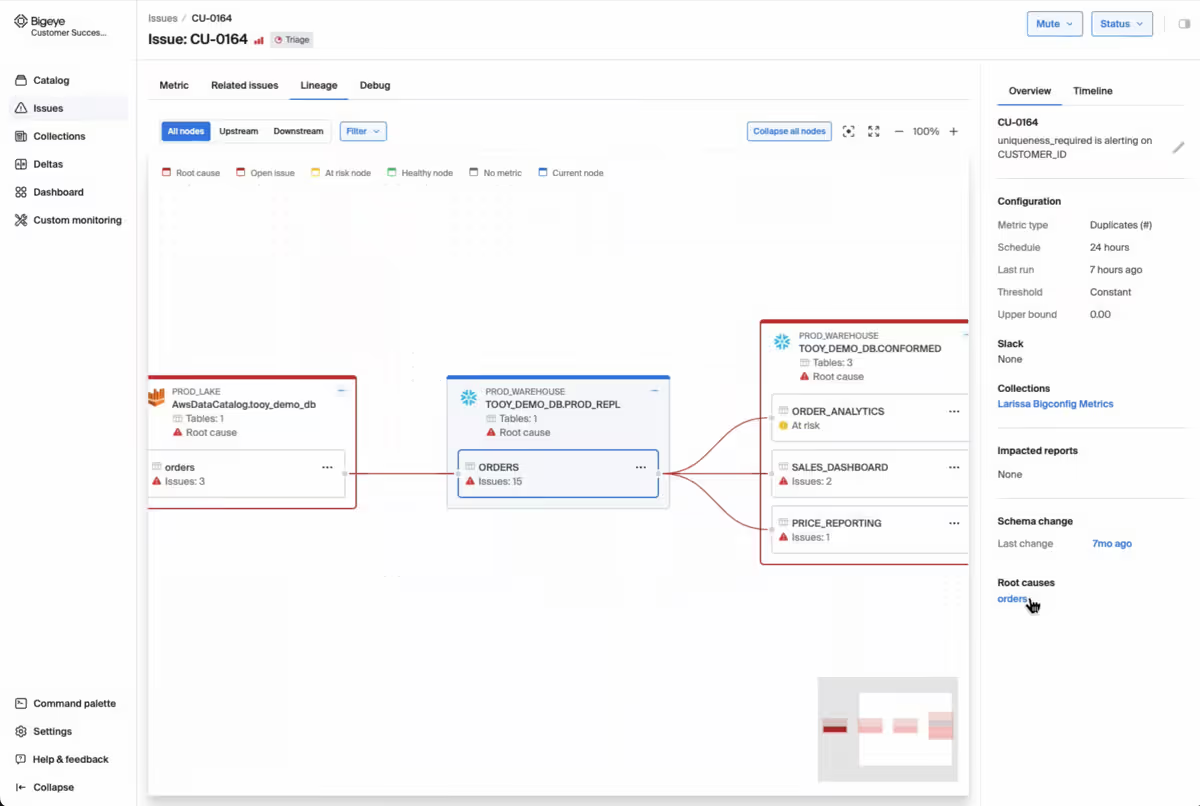
Bigeye is a lineage-enabled data observability platform designed for complex, enterprise-scale environments.
Its goal is to offer engineering teams rigorous, code-driven control over data monitoring and quality.
The platform tracks signals such as data freshness, volume, schema changes, and distribution shifts. Anomaly detection flags deviations proactively, and upstream dependencies are mapped to help trace the source and impact of issues.
It offers enterprise lineage technology, with column-level lineage across modern and legacy systems, including on-prem to cloud boundaries.
One of Bigeye’s strongest features is its configurability. Teams can write custom SQL checks, create virtual tables, and use auto-deployment of monitors via metadata patterns, table tags, or reusable YAML templates.
Bigeye’s monitoring-as-code framework, Bigconfig, allows all configurations to be version-controlled, auditable, and deployable.
Bigeye’s anomaly detection engine uses a multi-stage ML pipeline that learns baselines, flags deviations, and adjusts thresholds dynamically.
BigAI scans data warehouses, analyzes table usage, and recommends monitors based on risk and downstream dependencies.
The AI Trust Platform extends observability to model inputs, helping enforce data quality before data reaches production AI systems.
Bigeye excels when pipelines are codified, CI/CD workflows are mature, and engineering teams can manage configuration at scale. It offers precise anomaly detection, lineage tracking, automated recommendations, and full control over monitoring logic.
✅ What Bigeye is best for
- Critical dashboard reliability
- Complex enterprise pipelines
- Precise monitoring control
- High-security environments
❌ Where Bigeye falls short
- Implementation complexity
- Limited infrastructure monitoring
- Integration overhead
6. Metaplane: Best for Fast-Moving Data Teams
Ratings ⭐⭐⭐⭐⭐
G2 4.8/5
What Metaplane does
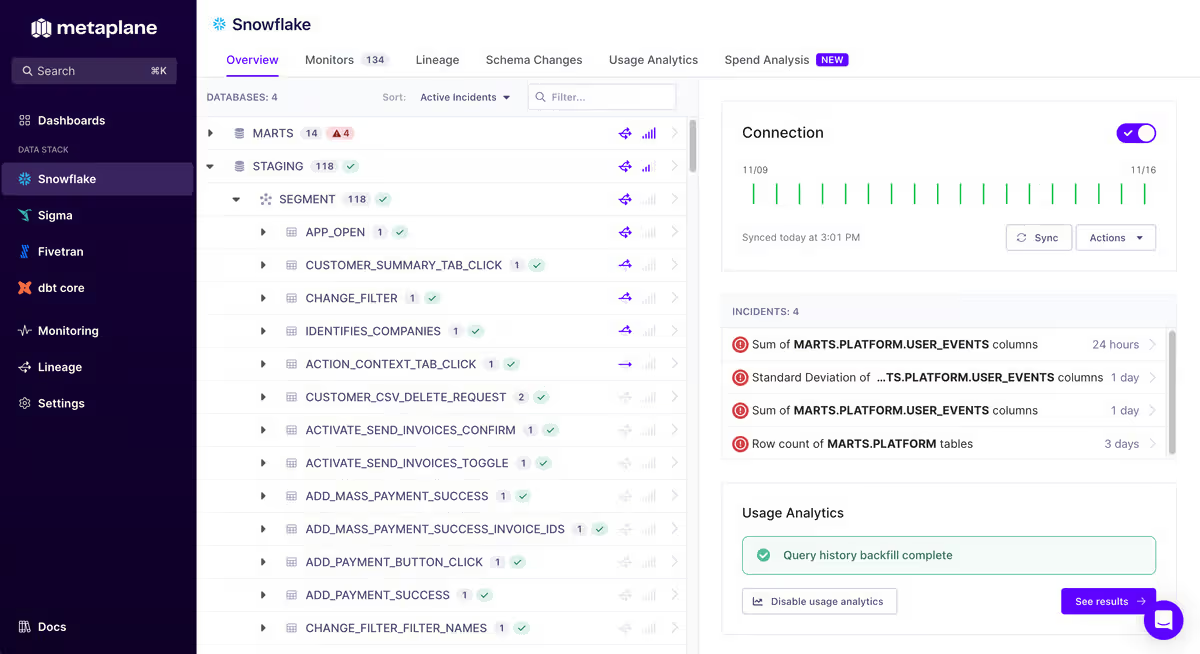
Metaplane is a lightweight, metadata-driven data observability platform designed for quick setup and self-service use.
It connects to cloud warehouses like Snowflake, BigQuery, Redshift, and Databricks, integrates with dbt Core/Cloud, and supports BI tools such as Looker, Mode, and Tableau, and integrates with Datadog.
Its read-only, metadata-based architecture allows teams to start monitoring in under 30 minutes with minimal engineering overhead.
The platform provides fast anomaly detection and monitoring across key data signals, including schema changes, table and column updates, volume shifts, and freshness.
Its ML engine learns from metadata automatically, eliminating the need for manual thresholds or tuning, while suggested monitors and group-by tracking simplify setup and expand coverage. Alerts are delivered via Slack, Teams, email, or PagerDuty, complete with charts and feedback options.
Metaplane includes automatic, column-level lineage that maps data flows from raw tables to dbt models and dashboards. This lightweight lineage helps teams quickly check impact and trace dependencies, though it lacks health metrics, transformation logic visibility, and deeper root-cause analysis.
Metaplane is best suited for small, modular data teams or startups needing fast, self-service monitoring without heavy engineering resources.
Pricing
Metaplane uses a usage-based pricing model centered on monitored tables, making cost directly proportional to how much of the data warehouse is actively observed.
The Free plan is designed for early experimentation and small teams. It includes monitoring for up to 10 tables, a limited number of users, and access to core data quality checks such as freshness, schema, volume, and basic anomaly detection.
The Pro plan introduces Metaplane’s core commercial model: pay per monitored table. As teams add monitors to tables or columns, those tables become billable once monitoring runs continuously. Pro expands feature coverage with column-level lineage, more advanced monitor types, cost and performance monitoring, Data CI/CD capabilities, and broader alerting integrations.
Metaplane’s Enterprise plan offers custom pricing. Enterprise customers still pay based on monitored tables, but gain access to SSO, private networking options, custom integrations, premium support, and deeper hands-on assistance from Metaplane’s team. This tier is designed for teams scaling observability across critical business domains while maintaining tight governance controls.
✅ What Metaplane is best for
- Fast implementation
- Cost-conscious monitoring
- Development workflow integration
- Mid-market data teams
❌ Where Metaplane falls short
- Limited enterprise features
- Basic business context
- Acquisition uncertainty
- Narrow observability scope
7. Soda: Best for Data Quality as Code
Ratings ⭐⭐⭐⭐⭐
G2 4.8/5
What is Soda?
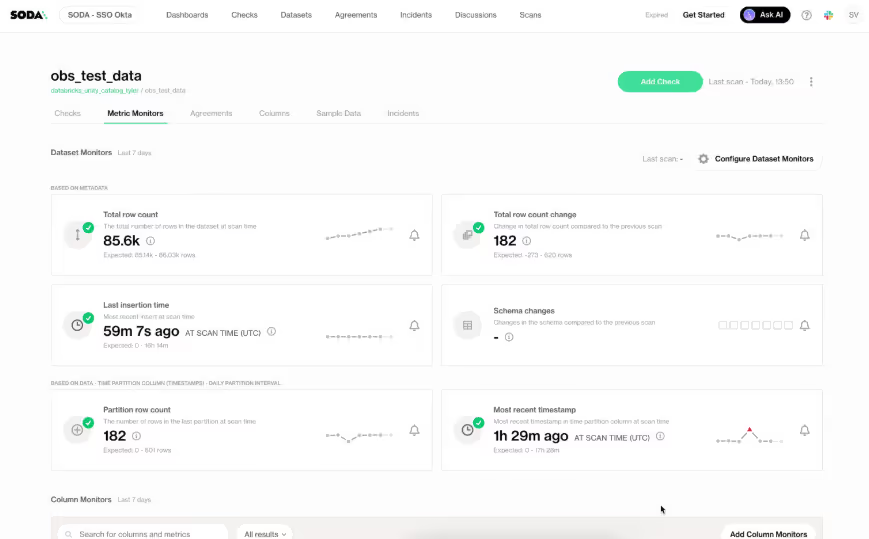
Soda is a data quality platform built around a declarative, pipeline-native approach.
Using its YAML-based language, SodaCL, teams define human-readable data quality checks which run directly inside pipelines via CI/CD or orchestration tools like dbt, Airflow, and Dagster.
Soda Core, the open-source engine, executes checks locally, while Soda Cloud adds dashboards, alerts, anomaly tracking, and collaborative data contracts. Soda Core provides free data quality testing with cloud platform for collaboration.
Contracts codify quality expectations between data producers and consumers, enforce roles, and provide historical insights, but all rules must be manually defined.
Monitoring and anomaly detection are metadata-driven, with ML-assisted drift detection and SodaGPT helping translate natural language into SodaCL code.
However, anomaly detection remains basic, focusing on threshold violations rather than behavior-based modeling or profiling.
Lineage is automatically generated at the column level, showing flow from raw tables to dashboards, but it lacks field-level detail, transformation visibility, root-cause tracing, or impact analysis.
Soda excels in small, engineering-led teams with clear, codified expectations.
Pricing
Soda.io offers a dataset-based pricing model that scales from lightweight data quality testing to enterprise-grade governance and collaboration.
Pricing is structured in tiers that reflect data surface area (number of datasets) and organizational maturity, with a strong emphasis on transparency and predictable costs.
The Free tier is designed for small projects and early experimentation. It allows teams to test and monitor up to three production datasets and includes core capabilities such as pipeline testing, metrics observability, and alerting integrations.
The Team plan is Soda’s primary commercial offering for data engineering teams. It includes monitoring for 20 datasets at a fixed monthly price, with pay-as-you-go expansion at a per-dataset rate as coverage grows.
For organizations that need broader collaboration, governance, and security, Soda offers an Enterprise plan with custom pricing. This tier builds on the Team plan with features such as collaborative data contracts, a no-code interface, advanced AI-powered data quality capabilities, audit logs, role-based access control, SSO, and private deployment options.
✅ What Soda is best for
- Cross-team collaboration
- Data quality as code
- Modern data stack integration
- Collaborative data culture
❌ Where Soda falls short
- Limited infrastructure monitoring
- Enterprise security depth
- Scalability questions
- Narrow observability scope
8. Datadog: Best for Infra + Data Correlation
Ratings ⭐⭐⭐⭐
G2 4.3/5
What is Datadog?
Datadog is a cloud-native observability platform that monitors infrastructure, applications, and logs in real time.
While traditionally focused on application performance monitoring (APM), Datadog has expanded into data observability with integrations for Snowflake, Redshift, BigQuery, and other cloud data warehouses.
Its data observability features rely on metadata tracking, anomaly detection, and dashboards to provide insight into data pipelines. Users can visualize data flows, monitor SLAs, and detect schema or volume changes, with alerts routed through Slack, PagerDuty, or email.
Datadog’s strength lies in centralized observability across both infrastructure and data, making it easier to correlate data issues with system performance.
Pricing
Datadog uses a modular, usage-based pricing model built around infrastructure scale, measured primarily by hosts, with additional charges for containers, custom metrics, logs, and add-on products.
Datadog prices each major capability (Infrastructure Monitoring, APM, Logs, Security, Digital Experience, AI Observability, and more) as separate SKUs, allowing organizations to pay only for the components they enable.
Infrastructure Monitoring is priced per host per month and offered in Free, Pro, and Enterprise tiers.
The Free tier supports a small number of hosts with limited data retention, while Pro and Enterprise add longer metric retention, machine-learning–based alerts, anomaly detection, and advanced governance features. Pricing scales predictably as host count grows, with discounts available for annual commitments, multi-year contracts, and high-volume environments.
Datadog’s Security and DevSecOps offerings follow the same per-host model, bundled into higher-priced SKUs that include cloud security posture management, vulnerability management, workload protection, and compliance mapping.
✅ What Datadog is best for
- Infrastructure and application observability
- Real-time alerting and dashboards
- Cross-system correlation
- Cloud-native data pipelines
❌ Where Datadog falls short
- Limited field-level lineage
- Manual anomaly tuning
- Less business-focused observability
- Heavy reliance on technical setup
9. Splunk: Best for Operational Intelligence
Ratings ⭐⭐⭐⭐
G2 4.2/5
What is Splunk?
Splunk is a data platform built for operational intelligence and enterprise observability. It captures, indexes, and analyzes machine data, logs, and metrics to monitor IT operations, security, and business workflows.
Splunk’s data observability capabilities include anomaly detection, SLA monitoring, and workflow analytics.
The platform uses dashboards, alerts, and AI-driven insights to detect patterns and troubleshoot issues across complex enterprise data ecosystems.
Splunk also integrates with cloud data warehouses and ETL tools to surface pipeline failures, schema changes, and downstream impacts.
Splunk excels in environments with high-volume, operationally complex data where cross-system correlation and security visibility are critical.

Pricing
Splunk offers a flexible, multi-model pricing approach designed to scale with different organizational needs, workloads, and usage patterns.
The platform allows customers to choose the pricing strategy that aligns with your business goals and data consumption, offering predictability or elasticity depending on how data is ingested, monitored, or analyzed.
For observability use cases, Splunk provides Entity-Based Pricing, which bases costs on the number of hosts or monitored entities, and Activity-Based Pricing, which ties costs directly to the monitored activities, such as metric time series, analyzed traces, sessions, or uptime requests.
This approach ensures organizations pay in proportion to the operational value derived from their observability data.
✅ What Splunk is best for
- Enterprise-scale data observability
- Operational intelligence
- Security and compliance monitoring
- High-volume log and metrics analysis
❌ Where Splunk falls short
- Setup complexity and learning curve
- Limited business context in alerts
- Cost-intensive at scale
- Less pipeline-native monitoring
10. IBM Databand
Ratings ⭐⭐⭐⭐
G2 4.3/5
What is IBM Databand?
IBM Databand is a data observability platform focused on pipeline reliability, data quality, and monitoring. It provides metadata-driven insights into data freshness, schema changes, volume anomalies, and SLA compliance.
Databand integrates with modern orchestration tools like Airflow and dbt, data warehouses such as Snowflake and BigQuery, and cloud storage platforms.
AI-assisted anomaly detection helps identify pipeline failures before they affect business outputs, while monitoring dashboards and alerting workflows allow both engineers and data teams to act proactively.
Its strength lies in detecting, alerting, and diagnosing pipeline issues with a focus on operational reliability and data contracts.
✅ What IBM Databand is best for
- Data pipeline monitoring and reliability
- SLA enforcement and anomaly detection
- Integration with orchestration tools
- Operational intelligence for large teams
❌ Where IBM Databand falls short
- Limited business-user visibility
- Less AI automation than newer agentic platforms
- Setup and configuration complexity
- Narrower focus on engineering vs enterprise collaboration
What is the best data observability tool?
The best data observability tool in 2026 is the one that helps your entire organization trust and act on data faster.
It prevents problems before they happen, catches issues before they impact business decisions, and makes data reliability everyone's responsibility, not just the data team's problem.
Choose platforms that solve your specific use case first, then scale. The most feature-rich tool isn't always the right tool. The right tool is the one that makes your data more reliable and your teams more productive.
If you’re ready to try the best data observability tool, book a demo with Sifflet today!
Frequently Asked Questions
What is the difference between Data Observability vs. Data Monitoring?
Data monitoring tells you when something goes wrong with your data, such as a failed pipeline or stale table.
Data observability goes deeper. It helps you understand why the problem occurred and how to resolve it. Observability combines metrics, lineage, anomaly detection, and root cause analysis to give your team actionable insights, not just alerts.
What are the 5 pillars of Data Observability?
The 5 pillars are critical metrics that ensure your data is reliable and trustworthy:
- Freshness – Measures how up-to-date your datasets are. Delays in data ingestion can directly impact decisions.
- Distribution – Tracks whether the values within your dataset match expected patterns or ranges. Unexpected changes may indicate errors.
- Volume – Monitors row counts, table sizes, or aggregate measures to detect missing or duplicate data.
- Schema – Detects structural changes like added, removed, or renamed columns that could break downstream pipelines.
- Lineage – Shows where data comes from, how it flows through your pipelines, and its downstream impact, helping to pinpoint issues and assess risk.
How do I choose the best data observability tool?
When evaluating tools, consider:
- Time-to-Value – How quickly can your team start getting insights after setup?
- Integrations – Does it connect with your data stack (e.g., dbt, Snowflake, BigQuery, Looker)?
- Full-Stack Visibility – Some tools focus only on your data warehouse, while enterprise platforms offer end-to-end observability across pipelines, lakes, and BI layers. Additional features like automated root cause analysis and business-aware alerts can dramatically reduce downtime.
Is there an open-source data observability tool?
Yes. Open-source options like Soda Core or Great Expectations allow you to test and monitor data quality with rule-based checks and custom tests.
However, they typically require more manual configuration, offer limited lineage tracking, and lack business-context awareness. Enterprise platforms like Sifflet, Monte Carlo, or Metaplane provide automated monitoring, AI-assisted root cause analysis, and business-aware alerts, making them better suited for large-scale, mission-critical data operations.
Can data observability improve business outcomes?
Absolutely. By proactively identifying data issues, reducing downtime, and enabling faster troubleshooting, data observability helps teams maintain trust in analytics and AI systems.
This translates into more confident business decisions, reduced operational costs, and better customer experiences.
How does pricing typically work for data observability platforms?
Most platforms offer tiered pricing based on usage metrics like monitored tables, datasets, or hosts:
- SaaS or self-hosted deployment options – Some platforms like Sifflet and Monte Carlo allow flexible scaling from small teams to enterprise-wide adoption.
- Pay-as-you-go vs. subscription – Tools like Monte Carlo and Metaplane let you pay per monitored asset for flexibility, while Soda.io and Datadog offer flat monthly rates with add-ons for additional features.
- Enterprise-grade plans – Include dedicated support, SSO, audit logs, and advanced governance features.
- Always compare pricing against time-to-value and the scope of observability to ensure ROI.


-p-500.png)
