


When a dashboard breaks or a metric drifts off-target, the first question is always: How quickly can we fix it?
But that only solves today's fire.
A better question is: Why did this happen, and how do we keep it from happening again?
That's what root cause analysis (RCA) delivers: prevention, not patchwork.
What is Root Cause Analysis?
Root cause analysis is a methodical approach to identify and resolve the underlying conditions that led to a failure.
It starts with establishing the facts:
- What failed? Was it a data quality issue, pipeline failure, or schema change?
- Where did it fail? Which table, dashboard, or data product was affected?
- When did it fail? At what timestamp or range did the issue first surface?
With those answers in place, the investigation moves upstream. Looking for recent changes in source systems, transformation logic, job configurations, and schema structure.
Lineage traces how the issue travelled through the stack, revealing both its point of origin and its downstream impact.
Verification confirms the suspected cause. Modern platforms automate this step through impact analysis, tracing the change through downstream systems to prove it triggered the failures. No manual cross-referencing needed.
Once confirmed, remediation begins. Teams correct the broken logic, update the pipeline, or adjust configurations to eliminate the issue at its source. If the failure exposed a broader weakness, like fragile dependencies or poor schema management, those are documented for follow-up.
The final step is prevention: making sure the same issue doesn’t happen again. That is accomplished by adding new tests, enforcing schema controls, or expanding monitoring to catch similar patterns earlier in the future.
Most data failures can be traced to a small set of recurring patterns. Here are four of the most common:
1. Schema Changes
Unintended or undocumented structural changes to source systems, such as renaming fields or adding columns, that disrupt transformation logic or dashboards.
2. Data Drift and Distribution Shifts
Drift occurs when the distribution of data changes while the schema remains the same. It can cause metrics to shift unexpectedly and degrade model accuracy and KPI reliability.
3. Missing or Delayed Data
Ingestion delays, failed dependencies, or scheduling misconfigurations that prevent data from arriving on time.
4. Infrastructure and Orchestration Failures
Pipeline stalls and failed orchestration triggers that interrupt data flows and delay downstream data delivery.
What is the Goal of Root Cause Analysis?
Root cause analysis traces errors to their origin and is a core method to improve quality and eliminate waste.
Today, you can find some form of RCA in nearly every industry, from global logistics to hospital patient care, to reduce costs and improve outcomes.
These are prime examples of how RCA turns symptoms into solutions:
- RCA in manufacturing
A hardware manufacturer received numerous complaints over widespread, multi-product defects shortly after delivery and installation. Warranty claims spiked, driving up replacement logistics and field repair costs, and risking reputational damage with their vendor partners.
Root cause analysis traced the issue to a flawed microchip embedded across several product lines. Product teams isolated the specific component that appeared in nearly every defective unit by analyzing error logs, batch records, and return patterns.
Engineers redesigned the chip, resolving the defect and stabilizing production.
- RCA in retail
A grocery retailer struggled with recurring stockouts on a fast-moving item. The result was empty shelves, lost sales, and frustrated customers and store managers.
The analytics team initially suspected faulty forecasting, but adjusted it repeatedly to no effect.
Root cause analysis, however, exposed a master data error. The supplier packages eight units per case, but the retailer allocated ten per case when billing stock to its retail stores. That caused inventory to look full on paper while shelves ran dry.
RCA pinpointed the mismatch by tracing discrepancies between warehouse intake records, supplier invoices, store-level stockouts, and system-reported availability.
These principles apply equally to data systems. RCA prevents costly downtime, improves decision-making, and builds enterprise-wide confidence in data assets.
Manual RCA vs. AI-Powered Root Cause Analysis
When performed manually, root cause analysis in data ecosystems is tedious and slow. Engineers sift through logs, retrace pipeline logic, and cross-reference recent changes, relying heavily on trial and error to uncover the source of errors.
However, as systems grow more complex, that model collapses. With dozens of sources, transformations, and interdependencies, manual RCA often turns into multi-day investigations involving multiple teams.
AI-powered root cause analysis relieves this burden. Machine learning models monitor lineage, detect anomalies, compare historical incidents, and highlight probable causes, often before users ever experience a problem.
And it all begins the moment an anomaly is detected.
AI-powered observability platforms track signals, trace dependencies, and resolve many issues, free of human intervention, by employing AI agents.
When a freshness delay, volume drop, or anomaly occurs, these agents go to work:
- Tracing upstream lineage to pinpoint the origin
- Correlating recent schema changes, deployments, or usage shifts
- Comparing against historical patterns to detect drift or breakage
- Assesses downstream consequences to prioritize what's business-critical
- Recommending solutions based on similar past incidents
- Adding the incident to history for future pattern recognition
- Implementing preventive controls based on root cause patterns
Combining detection, investigation, remediation, and prevention in a continuous, autonomous loop is the heart of AI-powered root cause analysis in data observability.
How Root Cause Analysis Works in Data Observability
In data observability, root cause analysis combines anomaly detection, lineage tracing, correlation, and impact scoring in a layered process to turn scattered alerts into precise diagnoses and resolutions.
Each step plays a role in identifying what broke, why it happened, what it impacted, and how to resolve it.
Anomaly Detection: Spotting Data Issues
Today's platforms don't rely on fixed thresholds. Instead, machine learning tracks freshness, volume, schema, and distribution over time, building a baseline of what normal looks like for each asset.
When a table that usually loads at 6 AM arrives at 9 AM, or volume that averages 1M rows suddenly processes 500K, the system flags the deviation immediately.
But anomaly detection also catches subtler patterns. If a metric that typically hovers between 50% and 55% gradually drifts toward 52% to 58%, that subtle shift could signal deeper quality issues.
AI detects these slow-moving patterns long before humans would notice.
Pattern-based detection connects related anomalies across tables and workflows, revealing broader system issues that might otherwise look like isolated noise.
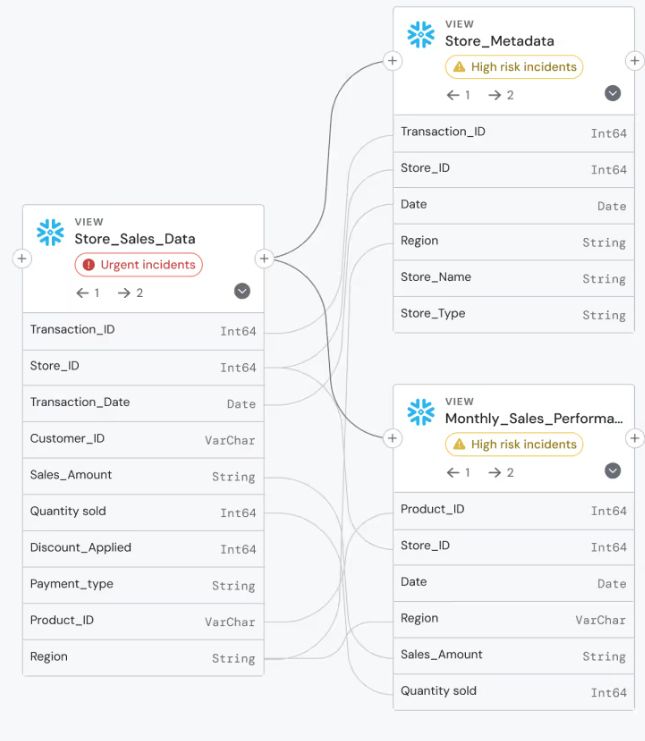
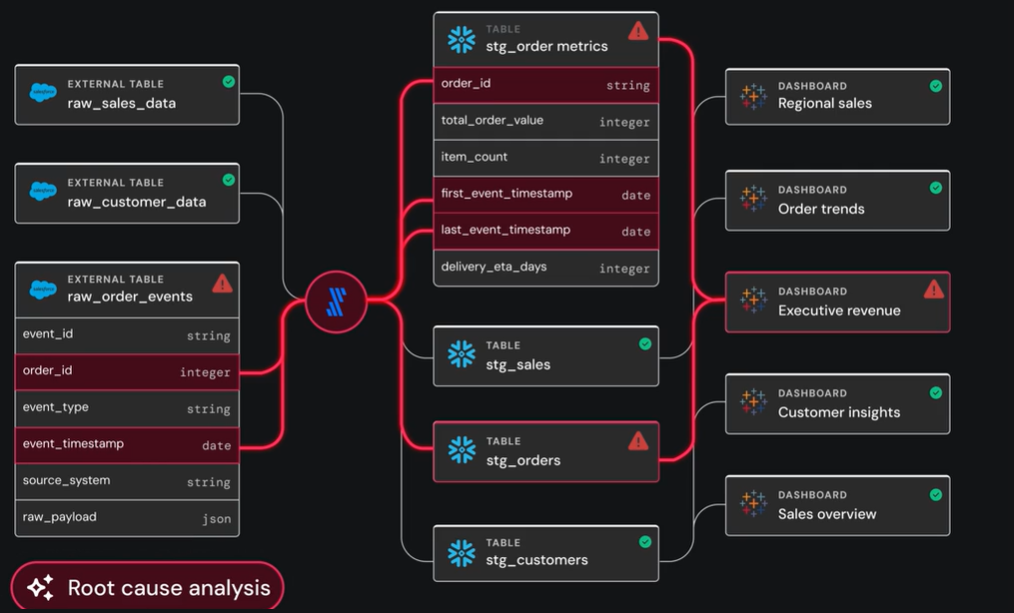
Lineage: Tracing What Broke and Where It Spread
Anomalies are symptoms, not causes. Lineage shows where they originated and what downstream systems they affect.
Lineage exposes the exact step where things broke by mapping data from source to transformation to downstream consumption. A missing column. A renamed field. A failed join. When a dashboard goes blank or a KPI turns stale, lineage reveals the trigger.
This traceability serves two purposes:
- Upstream tracking to isolate the actual point of failure
- Downstream analysis to assess what was affected and who needs to know
Without lineage, manual tracing through tables and transformations can take hours or days. With it, the connection between trigger and impact is immediate.
Correlation Analysis: Connecting the Clues
A single upstream failure can trigger dozens of downstream alerts. Correlation analysis identifies related alerts.
- Time-based correlation links anomalies that surface together.
- Dependency-based correlation connects symptoms to a shared source, such as a schema change or failed deployments.
- Multi-dimensional correlation integrates logs, metrics, and metadata to form a complete picture.
Instead of sending multiple, individual alerts, observability platforms cluster related notifications into a single, traceable incident to help streamline and speed resolution.
Impact Assessment: Prioritizing What Matters
Not every alert deserves a priority response. Impact assessments direct focus to the ones that do by evaluating who is affected, which business-critical dashboards or models rely on the data, and whether SLAs are at risk.
This context immediately reveals what to fix first. A freshness delay in the CFO's dashboard requires urgent action, while a similar delay in a sandbox table can wait.
Recommended Resolutions: From Diagnosis to Fix
Root cause analysis only delivers value when insight turns into action.
AI observability uses historical patterns from past incidents and environmental context to suggest the best next steps. Each resolution strengthens the model for future incidents, creating a feedback loop that makes the platform increasingly more accurate over time.
Benefits of Root Cause Analysis in Data Observability
Embedding RCA into the observability layer transforms incident response from reactive firefighting to proactive prevention. It manifests through four key benefits:
- Faster incident resolution
Automated, context-rich RCA eliminates time wasted chasing symptoms.
Speed protects business-critical flows from extended downtime, preventing minor anomalies from becoming high-impact escalations.
- Reduced manual investigations
Manual RCA drains time and attention. Engineers dig through logs, retrace pipeline logic, and rebuild timelines from fragmented clues.
Automated RCA changes everything by analyzing telemetry signals and historical patterns to determine root cause. Engineers validate, resolve, and move on.
With less investigative overhead, small teams can support complex environments without becoming trapped in reactive loops.
- More accurate diagnoses
AI-powered RCA captures what manual methods miss. It analyzes signals across systems, detects subtle correlations, and learns from every resolved incident.
As the platform resolves incidents, it learns. Precision improves and false positives decline. Over time, RCA becomes sharper, delivering better diagnoses without taxing support teams.
- Proactive prevention
Root cause analysis supports long-term data reliability by spotting recurring patterns and early degradation. It flags fragile dependencies, unstable configurations, and frequent stress points.
These insights drive the architectural improvements and lasting fixes that avoid recurring issues. This shift from reaction to prevention becomes possible only when RCA is automated and embedded in the observability layer.
How Sifflet Delivers Root Cause Analysis at Scale
Sifflet, an AI-Native data observability platform, turns root cause analysis into a unified incident workflow. Intelligent agents guide detection and diagnosis, while business context informs prioritization and resolution.
When an anomaly is detected, Sifflet opens a dedicated incident panel that combines the technical and business context required to resolve the issue quickly.
Sage, Sifflet's AI investigation agent, identifies the likely trigger. It highlights the upstream event, such as a schema change, pipeline delay, or distribution shift, and provides the surrounding context and timing.
An interactive lineage graph shows the affected data flow. Engineers can trace the path from source to downstream assets, with failed nodes and dependencies clearly marked.
Sifflet’s AI agent Sentinel ranks affected assets by business criticality. The incident panel shows which dashboards, reports, and models are affected, along with SLA exposure and ownership information.
Forge, Sifflet's remediation AI agent, generates tailored recommendations based on past incidents and the current system context. Teams can assign these actions, push them into Jira or ServiceNow, or notify stakeholders through Slack.
Each incident includes threaded discussions, status updates, and resolution history. Once resolved, the incident is logged into the platform's knowledge base to support faster RCA in the future.
This workflow eliminates guesswork and context switching. RCA becomes a guided process that helps teams find what broke, understand who's affected, and act on the fix without leaving the platform.
Scale Data Trust with RCA
Root cause analysis builds organizational confidence in data by replacing reactive firefighting with systematic, evidence-driven resolution.
It eliminates blind spots, cuts investigation time, and turns every resolved issue into a more intelligent, resilient system. With root cause analysis tooling woven into your observability layer, data reliability scales with your stack, not your headcount.
To operationalize RCA, your observability platform should support these core focus areas, each mapped to the way modern data teams work:
Root cause analysis checklist:
- Map end-to-end lineage from source to dashboard
- Monitor freshness, volume, schema, distribution, and lineage
- Use dynamic anomaly detection
- Surface root causes automatically
- Monitor for recurring incident patterns
- Track mean time to detection (MTTD) and mean time to resolution (MTTR)
- Watch false positive rates
That’s how you do root cause analysis.
Are you ready to take a live look at Sifflet's AI-Native data observability platform?
Book a demo to see how Sifflet detects, diagnoses, and resolves data issues in real time, before they cascade downstream.


-p-500.png)
