


2025 was the Year of the Dog. Datadog, that is.
In the spring of 2025 alone Datadog acquired Metaplane to add data observability and Eppo in May to introduce product experimentation to its infrastructure monitoring collection.
But Datadog wasn't done.
It launched Bits AI SRE in December, a feature that seeks to automate the high-stakes triage work that keeps engineers up at night.
For anyone shopping for data observability, Datadog's rapid expansion adds a new consideration. Yet, it also presents a bit of a dilemma.
Does a massive, integrated ‘observability conglomerate’ provide the depth you need? Or does it create a "Metadata Ceiling" that threatens to obscure the true business impact of your data?
In our Datadog review, we'll assess whether the platform's 2026 line-up creates a master of all trades or a jack of too many.
What is Datadog?
Datadog is a SaaS-based observability and security platform.
It provides an expansive, unified view of an enterprise's entire technology stack, from servers, databases, and applications to third-party services, all via a single, integrated interface.
Platform Infrastructure and Architecture
Datadog's architecture is rooted in its signature distributed-agent model, which prioritizes rapid deployment over local data control.
By installing a lightweight, open-source agent directly onto your hosts—whether physical servers, Kubernetes nodes, or serverless functions, Datadog starts auto-discovering your stack almost instantly.
Because Datadog is purely a SaaS platform, you don't have to build, patch, or scale your own monitoring servers. Datadog handles that for you.
The catch, however, is that you must constantly stream data out to their cloud. For larger companies, this telemetry firehose results in high cloud egress fees, making the convenience of SaaS a significant line-item expense in the cloud budget.
While Datadog has introduced CloudPrem to store some logs locally, the platform's core intelligence still resides in the Datadog cloud.
Native Integrations and AI Tools
The platform offers over 750 native integrations that can help visualize everything from legacy mainframes to the latest AI hardware.
Specifically for 2026, Datadog has leaned into the AI revolution with dedicated GPU Monitoring. It provides deep visibility into memory pressure and core utilization in AI clusters, which is crucial for preventing silent failures during expensive LLM training runs.
All of this amounts to a world-class view of the hardware layer, although it does bark back to the platform's former rap as an infrastructure-first tool. It sees the pipes of the AI world with incredible clarity, even if it loses sight of the business value flowing through them.
When is Datadog a Good Choice?
Datadog isn't a plug-and-play tool for everyone. To receive maximum return on its premium price, you generally need to fit one of these specific profiles:
- The Multi-Cloud Enterprise
If you’re managing thousands of instances across AWS, Azure, and GCP simultaneously, Datadog's 750+ integrations provide a common language that few other tools can match.
- The Consolidation-First Team
If your CTO is demanding that you kill off five different point solutions (for logs, traces, security, and metrics) and move to a single vendor, Datadog is a credible candidate.
- High-Velocity DevOps
Organizations that deploy code dozens of times a day will appreciate the real-time correlation that Datadog provides.
Datadog's Top Use Cases
So, what does Datadog do best?
Datadog can scale AI Workloads thanks to its new GPU monitoring. Datadog is a good choice for teams that are training large models that need to monitor hardware health just as much as software latency.
The platform can carry out cloud migrations which are often used as the visibility layer during a lift-and-shift. Datadog does a credible job of revealing performance gaps between on-prem and cloud environments.
With unified security operations, Datadog is a good choice for those teams that are implementing DevSecOps. Datadog lets SREs see security threats (such as a SQL injection attempt) alongside the performance spikes they cause.
While these use cases prove Datadog's power at the infrastructure and security layers, they do leave a visibility gap at the content layer.
Monitoring the health of a GPU tells you nothing about the quality of the data feeding your LLM. This gap is where the Metadata Ceiling becomes a real barrier for data-driven enterprises.
Deep Dive into Datadog’s Features
Datadog's shift to a conglomerate has made its feature set a sprawling map of interconnected modules. The platform has moved beyond simple monitoring to a high-definition observability engine.
But this depth comes with distinct operational trade-offs.
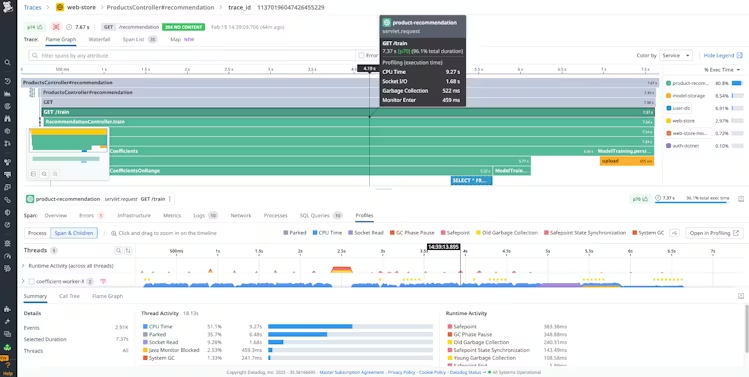
1. Unified Full-Stack Observability
The heart of Datadog's value proposition lies in its seamless integration of metrics, logs, and traces.
The Application Performance Monitoring (APM) and Distributed Tracing modules allow an engineer to follow a single request as it hops across hundreds of microservices. Bolstered by Service Maps that live-update based on real traffic, users can see precisely where latency is occurring.
Datadog’s Log Management suite continues to lead with its Logging without Limits architecture. It lets you ingest everything while only paying to index what you actually need.
Recently introduced Flex Logs have made long-term storage and high-volume analysis more cost-effective for regulated industries that can't just delete data.
For the user experience layer, Digital Experience Monitoring (DEM) combines Real User Monitoring (RUM), synthetic tests, and session replay. That means you can watch real user sessions to see exactly where people get stuck—whether it's a rage click on a broken button or a checkout flow that hangs indefinitely.
This is supported by Cloud Audit Trail, which provides a tamper-proof record of user activity for SOC2 and HIPAA compliance.
2. The Metaplane Integration
Metaplane has been fully absorbed into what is now branded as Datadog Data Observability. It was a significant strategic move, bringing column-level lineage and automated quality monitors (freshness, volume, schema changes) directly into the same UI used by DevOps teams.
For the Data Engineer, this integration is highly efficient. You can see a Snowflake pipeline failure right next to a spike in your Airflow task latency.
It's here, however, where the all-in-one model starts to hit what we call the Metadata Ceiling. Datadog's data observability is focused on the health of the pipeline. It can tell you whether a table failed to update or if a schema changed, but it lacks the Business-Aware context required to understand the data's content.
It can't tell you that a technically successful pipeline just delivered null values into your CFO's Global Revenue Report. While it monitors the pipes with world-class precision, it remains mostly blind to the business value of the water flowing through them.
3. Database Monitoring (DBM) & Query Analysis
Datadog's Database Monitoring (DBM) has become a cornerstone of the platform.
For teams that manage complex Postgres, MySQL, or Snowflake environments, DBM goes beyond simple ‘is it up’ checks by delivering deep visibility into query performance.
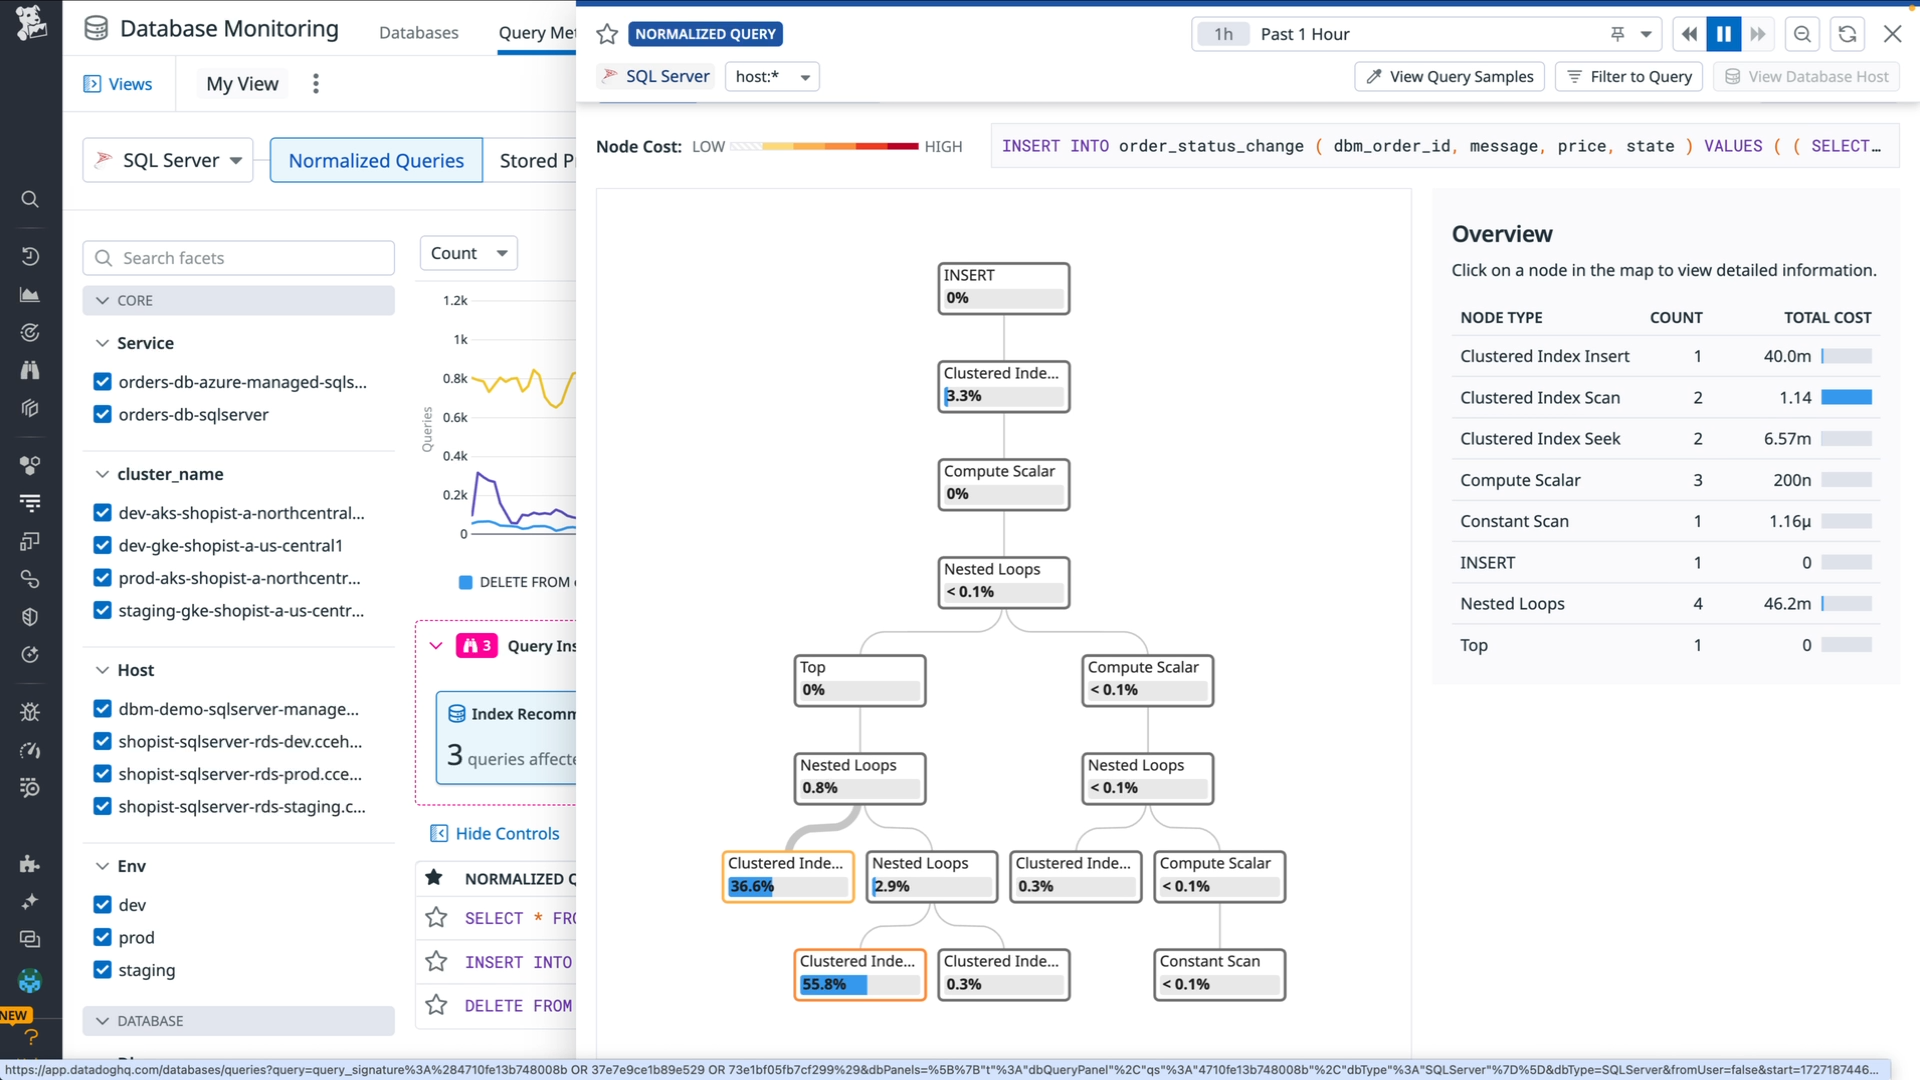
Its standout capability is Query Regression Detection, which uses anomaly detection to identify SQL statements that have suddenly become slower or more resource-intensive after a code deployment.
The platform provides a query-centric view, allowing engineers to see execution plans and explain-plan insights directly in the dashboard. This view makes it incredibly easy to find a missing index or a rogue join that is causing a CPU spike.
But again, this feature illustrates the platform's infrastructure-first DNA perfectly. It can tell you that a query is running slowly, but it won't tell you whether it's returning the wrong data. It monitors the engine's health but remains indifferent to the quality of the fuel.
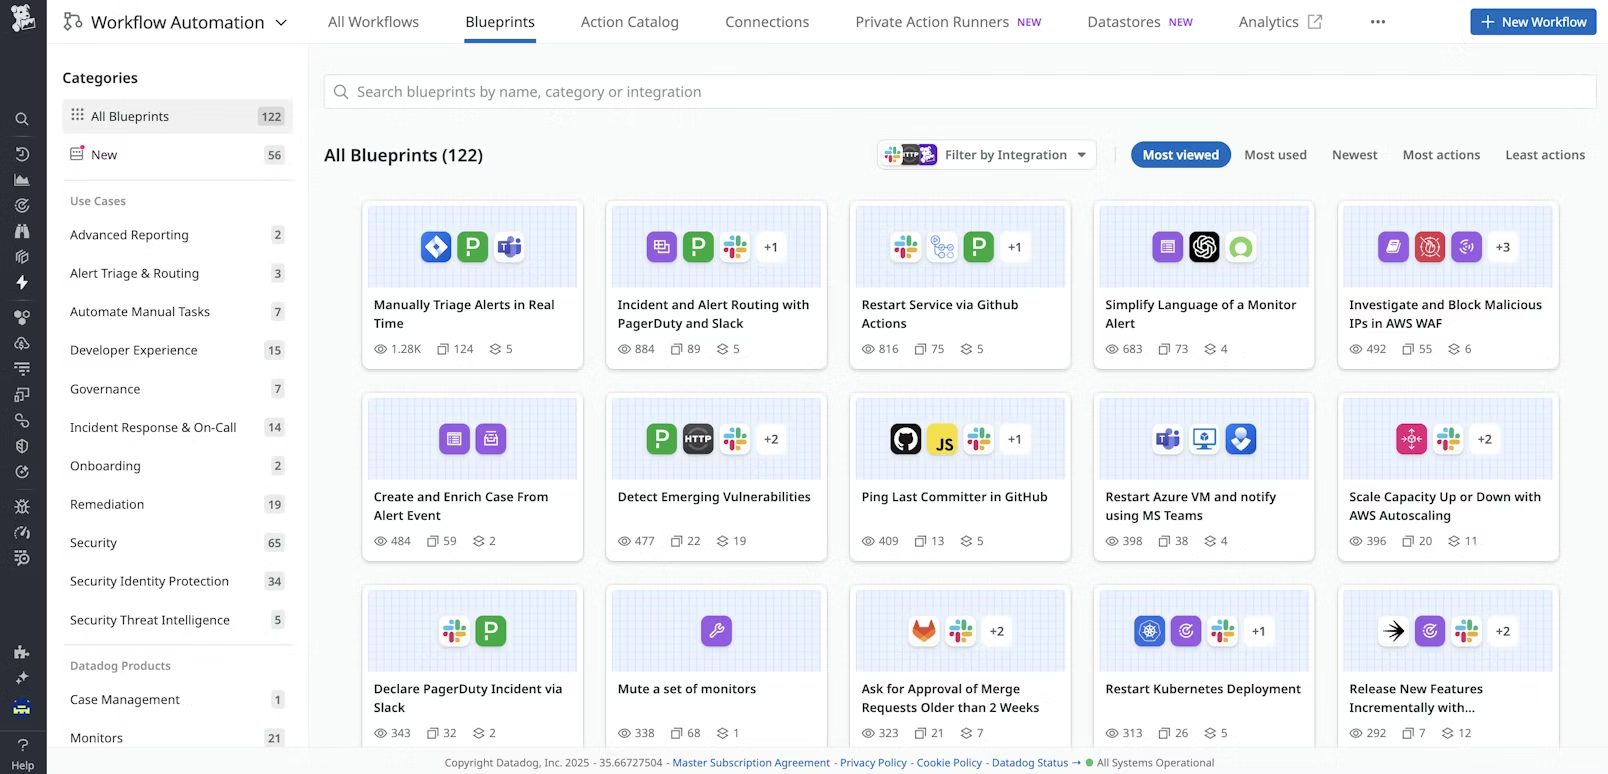
4. Bits AI SRE
The most significant evolution in offering is the move from reactive dashboards to autonomous investigation.
Bits AI SRE which reached general availability in December 2025, is no longer a simple chatbot; it is a telemetry-aware agent designed to act as a first responder.
When a high-severity alert fires, Bits AI SRE immediately begins an investigation before an on-call engineer can even reach for their laptop. It scopes your metrics, logs, traces, and internal runbooks to test multiple hypotheses in parallel, separating the signal from the noise.
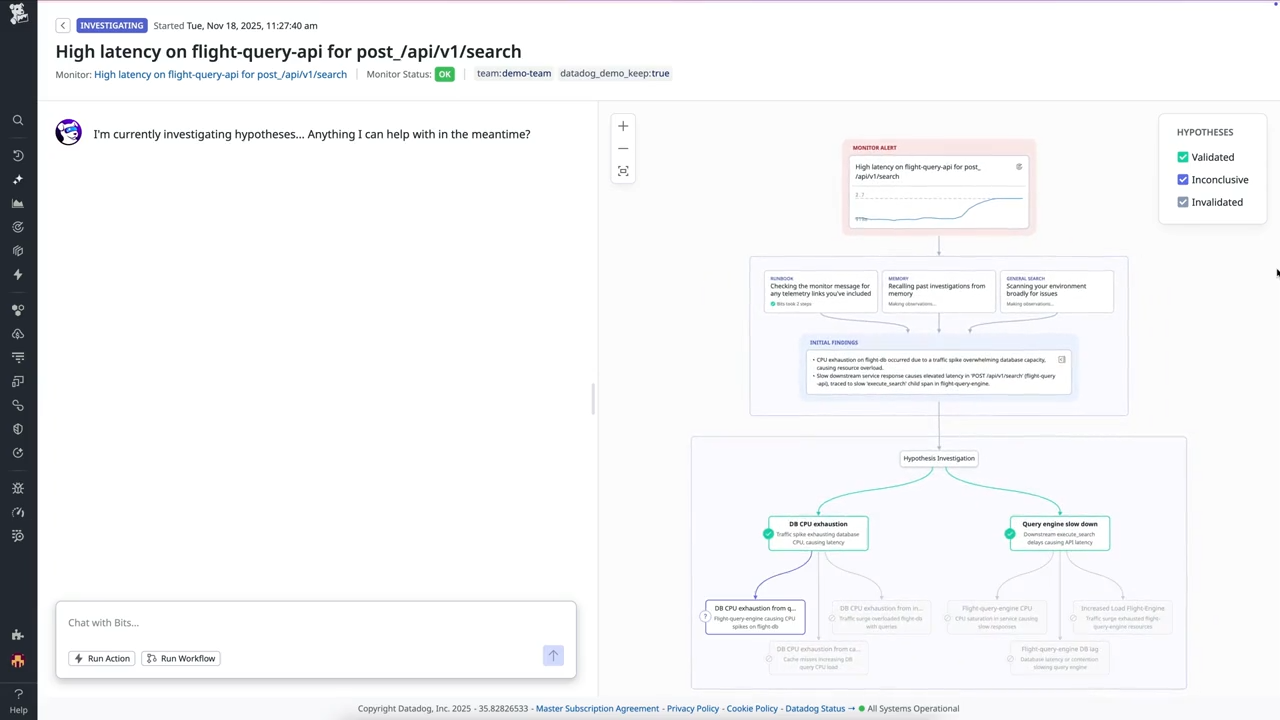
By the time the engineer logs in, Bits AI has mapped a causal narrative, identified the originating failure, and suggested actionable next steps.
For many teams, this has fundamentally changed the first five minutes of an incident, reducing cognitive load and significantly dropping MTTR.
However, for the skeptical buyer, the navigator, not pilot distinction is critical.
While Bits AI SRE is world-class at triage, it’s not a fully autonomous actor. It provides a short story of the failure, but the high-stakes remediation, such as a production database rollback, still requires a human in the loop.
4. LLM Observability: Monitoring the AI Brain
As Large Language Models (LLMs) move from experimental labs to the core of the business, Datadog has introduced a dedicated LLM Observability suite. This feature provides end-to-end tracing for AI prompts, tracking critical metrics like token usage, request latency, and model costs. It even includes native evaluation frameworks designed to detect common issues like hallucinations or prompt injections.
While these are essential tools for keeping AI applications running, this is precisely where the Metadata Ceiling is lowest. Datadog monitors the model's performance using AI-based judges to score its output. It can tell you if the AI thinks the answer is low-quality, but it still can’t tell you if the underlying data in your RAG pipeline was corrupted.
If your vector database is serving stale or null data as context, Datadog’s engine will process it perfectly, and its AI judge might even rule it coherent. But it remains blind to the source’s data integrity, a gap that separates monitoring an AI model from the business truth of its output.
But enough about what we think. Let's see what Datadog's real-world users have to say about their experiences through candid online reviews.
User Reviews: A Tale of Two Cities
⭐⭐⭐
G2 4.4/5 | Capterra 4.6/5 | Trustpilot 2.4/5
The market sentiment on Datadog is a study in contrasts.
Users consistently praise the platform for its seamless correlation capabilities.
Engineers appreciate being able to click on a spike in a dashboard and instantly trace it back to the corresponding log entry and the exact line of code responsible, streamlining debugging and root cause analysis.
Another major highlight is the setup speed, organizations can begin monitoring even complex Kubernetes clusters within minutes, dramatically reducing time-to-value.
Despite the platform’s depth and sophistication, the user interface remains remarkably polished and intuitive, earning recognition as one of the most refined UIs in the industry.
However, users also report notable pain points.
Unpredictable costs are a frequent concern, with high-cardinality tags sometimes turning a $1,000 experiment into a $10,000 invoice overnigh.
Support responsiveness has also been criticized; as the company has grown, some enterprise users feel support has become more scripted and slower, often taking 24–36 hours to address non-production issues.
Finally, the UI, while powerful, can be overwhelming for junior engineers. With over 750 integrations and multiple sidebars, newcomers can feel paralyzed by the platform’s breadth and complexity.
✔️ Pros
- Unified Everything: Metrics, logs, traces, security, and data quality in one tab.
- Bits AI SRE: A real force multiplier for incident triage and MTTR reduction.
- Global Discovery: Auto-discovers almost any resource across AWS, Azure, and GCP.
✖️ Cons
- The Datadog Tax: Pricing is complex and punitive for high-scale, high-cardinality environments.
- Horizontal vs. Vertical: By trying to be everything, specialized features (like data observability) can feel thin compared to purpose-built platforms.
- Vendor Lock-in: The deeper you go into their AI and Security agents, the harder it is to maintain a flexible, multi-vendor stack.
Is Datadog Worth It?
Datadog remains a strong choice for SRE and DevOps teams. If your primary goal is infrastructure uptime and you have the budget to ignore their minibar prices, it's hard to beat. But the Datadog Tax is real.
For companies in FinTech, Healthcare, or AI-heavy enterprises where data is the product, relying on an infrastructure tool for data reliability is a risky bet. Datadog's Metaplane approach is a solid technical add-on, but it broadly misses the business meaning of data, and that comes with its own unique cost.
For teams that require business-technical collaboration and want to avoid the Metadata Ceiling, a specialized data observability solution like Sifflet offers the Business-Aware lineage and multi-cloud flexibility that Datadog's infrastructure-first DNA currently lacks.
Our Verdict: Use Datadog if you want to keep your servers running, but rely on a dedicated data observability platform like Sifflet to keep the data on those servers 100% trustworthy and reliable.


-p-500.png)
