


Data monitoring, meet metadata.
It's the missing context behind every failed pipeline, stale table, or broken dashboard.
Metadata fills in the details that basic checks can't.
Details that make monitoring make sense.
What Is Data Monitoring?
Data monitoring is the ongoing process of analyzing and validating data quality. It uses automated and manual checks against predefined standards to monitor data quality, detect errors, and anomalies.
Legacy monitoring offers surface-level checks: row counts, job success, and threshold alerts. They show what failed, but not where or why.
Today's stacks demand more from monitoring: deeper context and visibility from sources, through transformations, to downstream processes.
That context comes from metadata.
Metadata as The Foundation of Current Data Monitoring
Context is the bridge between detection and explanation.
It connects what failed to why it happened, where it started, and what a failure touched.
Metadata provides critical context by showing what failed, where in the pipeline it lives, who owns it, and basic relationships.
For example, Traditional monitoring might flag that a pipeline feeding a sales dashboard failed overnight. You get an alert: "ETL job failed at 2:14am."
The notification tells you what happened and when, but you still have to investigate which data was impacted, what schema was involved, and what business processes rely on it.
Metadata-driven monitoring enriches that alert with additional context:
- Which dataset and columns were affected
- The owner or steward responsible for the pipeline
- Downstream dashboards, reports, and business teams that rely on the data
- Where the issue started, if the schema or data freshness was out of compliance, and who's responsible for addressing the problem
That difference turns an alert into actionable evidence.
A metadata-driven monitoring strategy uses three core types of metadata:
Technical metadata defines how data is structured. Including schema, data types, and source systems.
Monitoring uses it to verify the expected structure of each dataset and report deviations such as schema drift, null spikes, or missing fields.
A sudden change in the "price" column type triggers a schema-change alert before it breaks downstream reports.
Operational metadata shows how pipelines and jobs run. Monitoring uses it to connect runtime, refresh, and dependencies.
A missed pipeline run is immediately linked to delayed dashboard refreshes in Looker, pinpointing both the cause and effect.
Business metadata defines ownership, business rules, and purpose. Monitoring uses it to route alerts to the right owners and highlight issues tied to business-critical data.
When a revenue dataset fails freshness checks, ownership tags route the alert directly to the finance steward for review.
These metadata layers connect structure, behavior, and accountability in ways that enhance data monitoring beyond surface-level checks.
Components of a Metadata-Driven Monitoring Strategy
A metadata-driven monitoring strategy links how metadata is collected, enriched, and governed.
Each layer strengthens the next.
1. Metadata Collection
Monitoring starts with a complete view of your data environment.
Automated scans pull technical, operational, and business metadata from warehouses, pipelines, and BI tools. These scans detect new datasets, schema changes, and transformation jobs as they happen.
2. Metadata Enrichment
Enrichment adds the context that monitoring needs.
Classification, ownership tagging, and lineage mapping show how data moves through the stack and what depends on it downstream. Monitoring uses this context to interpret changes and understand their impact.
3. Governance
Governance keeps metadata accurate and usable.
It defines who maintains metadata, reviews updates, and enforces quality. Access controls and audit logs provide oversight, and stewardship assigns clear ownership so every alert reaches the right person.
These components provide the context for metadata-driven data monitoring.
Build a Signal Layer Behind Monitoring
Before building your monitoring strategy, you need the right metadata foundation.
Tagging is the signal layer that connects every dataset to the policies, owners, and business rules that monitoring depends on
A strong metadata tagging strategy includes four elements:
1. Valuable Tags
Start with the metadata your monitoring rules rely on:
- Owners and stewards
- Business domains (Finance, Sales, Operations)
- Sensitivity and compliance markers (PII, GDPR)
- Operational attributes (SLA tiers, refresh schedules)
- Data quality expectations (critical fields, freshness requirements)
These tags give monitoring the context to prioritize alerts, enforce standards, and route incidents to the right person.
2. Tagging Standards
Consistency is what makes tagging useful.
Create clear rules for:
- How owners are recorded
- How business terms are assigned
- How sensitivity labels are applied
- How operational SLAs are tagged
- Which fields require mandatory tags (e.g., PII, owner, description)
These standards make tags predictable and usable across monitoring workflows.
3. Automation Wherever Possible
Manual tagging can be tedious and prone to error. Use automated detection to assign tags for:
- Sensitive data (PII, financial values)
- Business domains (based on lineage or query patterns)
- SLA tiers (based on pipeline schedules)
- Critical fields (based on usage and downstream dependencies)
Automation keeps tags accurate as your environment changes and reduces the risk of blind spots.
4. Validation and Implementation of Metadata Tags
Tags drift as systems evolve.
Monitoring improves when you routinely:
- Review untagged assets
- Confirm owners and stewards
- Update tags after schema or pipeline changes
- Remove stale or outdated labels
Accurate tagging ensures your monitoring rules remain connected to your business priorities.
The next step is building the strategy itself.
How to Build a Data Monitoring Strategy
Building a monitoring strategy follows a simple sequence: inventory what exists, decide what you need, set the rules that enforce it, and refine the system as your environment changes.
Step 1. Audit and Inventory Metadata
Start by mapping what you already have.
Catalog your sources, pipelines, tables, and business assets. Assess metadata for completeness and consistency, and surface gaps or redundant entries.
This baseline shows what you can monitor today and where your next improvements should land.
Step 2. Define Objectives
Monitoring should support business outcomes.
Set measurable goals for metadata completeness, coverage, incident reduction, SLA performance, or compliance visibility.
Examples:
- 95% metadata completeness within six months
- Fewer than 1% critical data incidents per quarter
- 100% of all PII datasets are classified and tracked
Clear objectives anchor monitoring to risk, trust, and performance targets that matter.
Step 3. Design Metadata Standards
Standards are what make monitoring scalable.
First, decide who will define your standards, whether a governance committee or a designated owner. A single source to set standards is your best bet in order to keep consistency.
Define standards for tagging, naming, and versioning data assets, and record these in your business glossary. Clear conventions are crucial for consistent and reliable standards.
Step 4. Implement Monitoring Rules
Turn your standards and objectives into active checks.
Instead of keeping expectations as informal guidelines, formalize them into explicit rules that can be monitored.
Start with metadata completeness by requiring every table to have an assigned owner and a clear, useful description.
Next, define data-quality expectations such as acceptable thresholds for null rates, allowed value ranges, and requirements for data freshness.
Finally, establish rules for operational reliability, including expected pipeline runtimes and execution SLAs.
Rules are what give monitoring structure, making exceptions easier to spot.
5. Review and Refine
Monitoring evolves with your data.
Track false positives and note recurring issues; they indicate that standards need tweaking. Similarly, solicit feedback from data users and adjust standards and strategy as needed based on their experiences.
Periodic review builds stronger execution over time.
A monitoring strategy gives you coverage and control.
Data observability builds on that foundation by adding the context needed to diagnose and resolve issues.
Sifflet brings these capabilities together in one platform.
Sifflet Goes Beyond Data Monitoring
Metadata-driven monitoring delivers clearer alerts and improved context over traditional data monitoring.
Yet, time spent investigating root cause, reconstructing lineage, and validating impact by hand still burdens those tasked with resolving alerts.
Sifflet moves monitoring into full data observability.
Its platform uses active metadata and AI agents to deliver proactive detection, automated diagnosis, and end-to-end understanding of system health.
Here's Sifflet elevates data quality monitoring and issue detection.
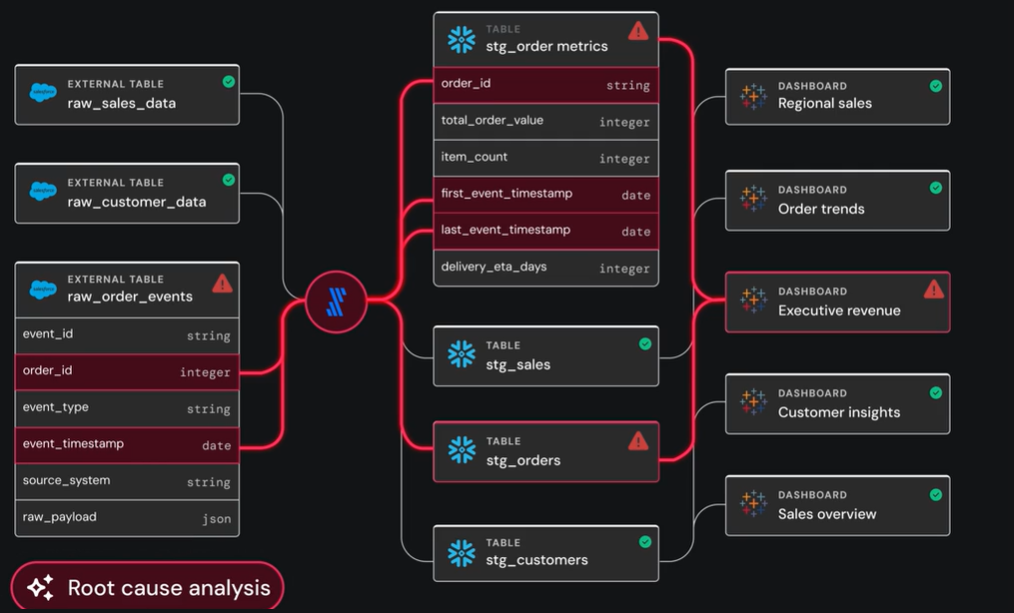
- Automated root-cause analysis
When a dashboard breaks or a pipeline stalls, Sifflet goes beyond notification.
Its AI agents trace lineage upstream to pinpoint the exact change that triggered the issue and every downstream asset affected.
You receive a clear explanation of what happened and why, not just a timestamp.
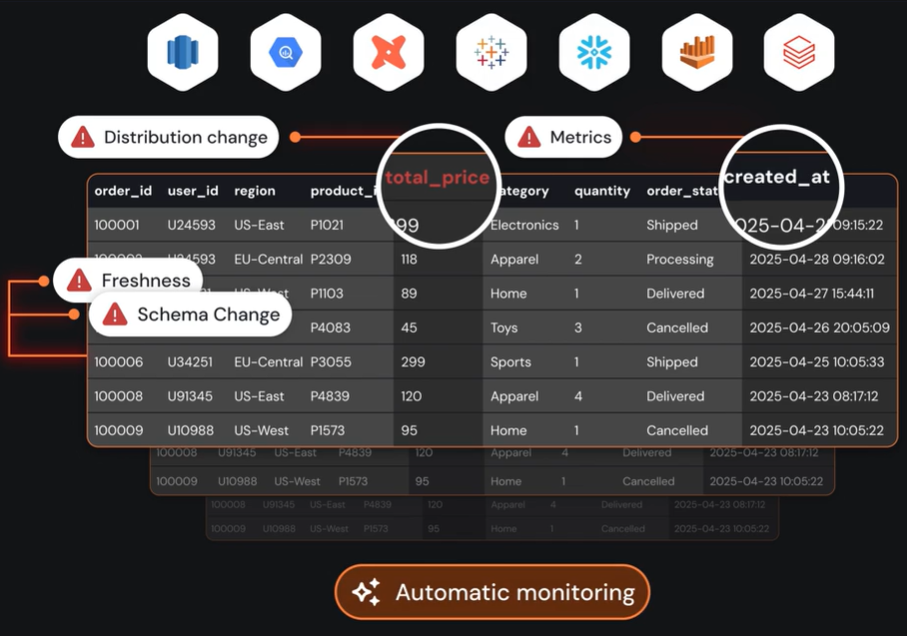
- Proactive detection and early warnings
Sifflet's agent, Sentinel, learns behavioral patterns across all of your datasets and pipelines. It flags anomalies that predefined checks would miss and alerts you to emerging risks before they become incidents.
Your monitoring adapts as your data evolves.
- Full context and impact mapping
Sifflet depicts how data moves across warehouses, pipelines, and BI tools.
When a freshness or volume issue appears, data lineage maps every dashboard, model, job, and stakeholder affected.
Sifflet prioritizes by business impact, directing your remediation efforts to the issues that matter the most.
- Ownership and guided remediation
Business metadata drives response workflows.
Sifflet routes incident alerts to the right owner, highlights relevant policies, and uses another of its agents, Forge, to guide corrective actions in accordance with established procedures.
Incidents reach the right people with the right context.
- Continuous improvement
Sifflet captures outcomes from every alert and resolution.
Agents refine baselines, reduce noise, and strengthen monitoring coverage over time.
Sifflet observability improves with every incident.
Metadata-driven monitoring improves clarity, but it stops at detecting symptoms and enriching alerts after issues appear.
What you really need is Sifflet data observability.
Sifflet's Data Observability Outperforms Metadata-Driven Monitoring
Data observability goes further. It combines active metadata, behavioral signals, and intelligent automation to diagnose root causes, reveal end-to-end impact, and guide remediation without manual investigation.
Monitoring tracks events. Sifflet's observability explains and helps you resolve them.
It's time to bring observability into your data operations.
Start your observability journey with Sifflet and build a data environment you can trust.
Book your demo today.


-p-500.png)
