


You're at the board meeting, presenting the Ad Spend numbers for all global campaigns. The slide shows the company is right on track with spend-to-date at $2.4M.
The CMO frowns, leans in, and whispers: "How sure are you about that number?"
You came in feeling pretty good about it. But right this second? Not so good.
Because now, you're mentally auditing every step of the pipeline.
You're suddenly suspicious of that minor Google Ads API update late yesterday.
What might have happened last night?
You need a Data Observability Health Score, a quick reference as to whether or not your metrics are actually fit for use.
What is a Data Observability Health Score?
A Data Observability Health Score is an aggregated metric that quantifies the reliability and veracity of a data asset.
By combining real-time signals—including freshness, volume, schema, and distribution—the score provides a decisive indicator of whether a metric, table, or dashboard is currently fit for consumption.
Think of it as a credit score for your data.
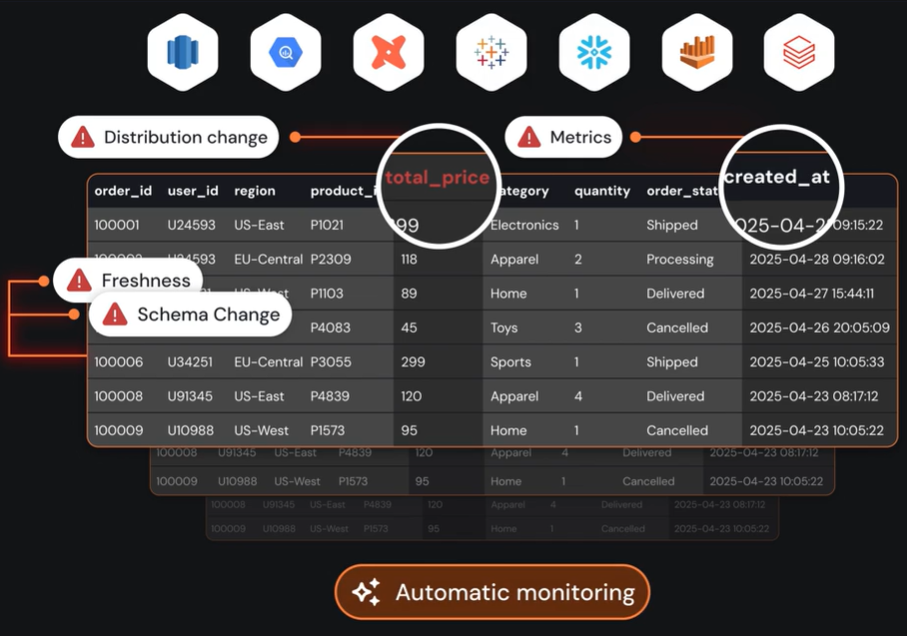
While traditional monitoring focuses on uptime (is the pipe broken?), a health score assesses the integrity of the information flowing through those pipes. It replaces manual mental audits with a single signal based on five critical observability KPIs:
- Freshness: Is the data current?
- Volume: Is the data complete?
- Schema: Is the structure intact?
- Distribution: Is the data accurate?
- Lineage: Is the source healthy?
But how do these five technical pillars translate into a decision-making tool?
Sifflet's Asset Health Status Categories
In Sifflet's Data Observability platform, these KPIs are used to deliver an Asset Health Status, a dynamic indicator of the trust your data warrants at any given moment.
Mapping these signals to a reliability framework provides everyone, from analyst to CMO, with immediate context on the health of their data:
The health score provides the underlying measurement, while Asset Health translates that score into an immediate trust signal anyone can act on.
Closing the Data Trust Gap with Sifflet
Sifflet makes data observability a business-context asset that solves the last mile of data trust. Here's how:
1. Sifflet Insights: The Trust Signal in Your BI Tool
Sifflet Insights is a Chrome and Edge browser extension that overlays an Asset Health Status directly onto dashboards in Tableau, Looker, or Power BI.
When the CMO asks, "How sure are you about this number?" you can click the indicator on the Asset Health dashboard that shows the exact time the monitors last ran and their status.
Beyond the status, you see the Last Success timestamp, which proves the data was verified minutes ago. It also discloses the asset's specific owner and metadata tags.
If the status is High Risk 🟠, you'll know exactly who is responsible for the fix and the issue's business context. So, instead of "I'll have to look into that," you can say: "Our Data Steward is already resolving a minor sync delay with the Google Ads API, but the core figures remain accurate as of 10 minutes ago."
You've traded an apology for an action plan.
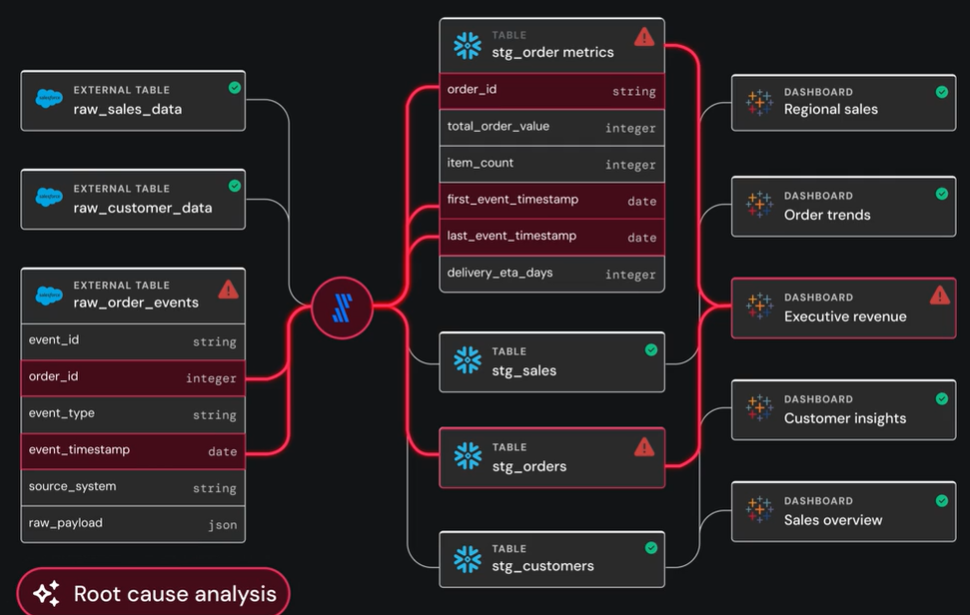
2. Inherited Health via End-to-End Lineage
Sifflet monitors the entire Data Supply Chain. In a typical stack, data passes through multiple hands, from an API to a warehouse to a transformation tool—before it ever reaches your screen.
- Inherited Health: Sifflet automates data lineage, so dashboards inherit the health of every table, dbt model, and API sync that feeds it.
- Automated Propagation: If a source table in Snowflake suffers a schema change or a freshness delay, Sifflet automatically propagates that Urgent 🔴 status downstream.
Sifflet stops silent data failures by flagging compromised data before it reaches dashboards.
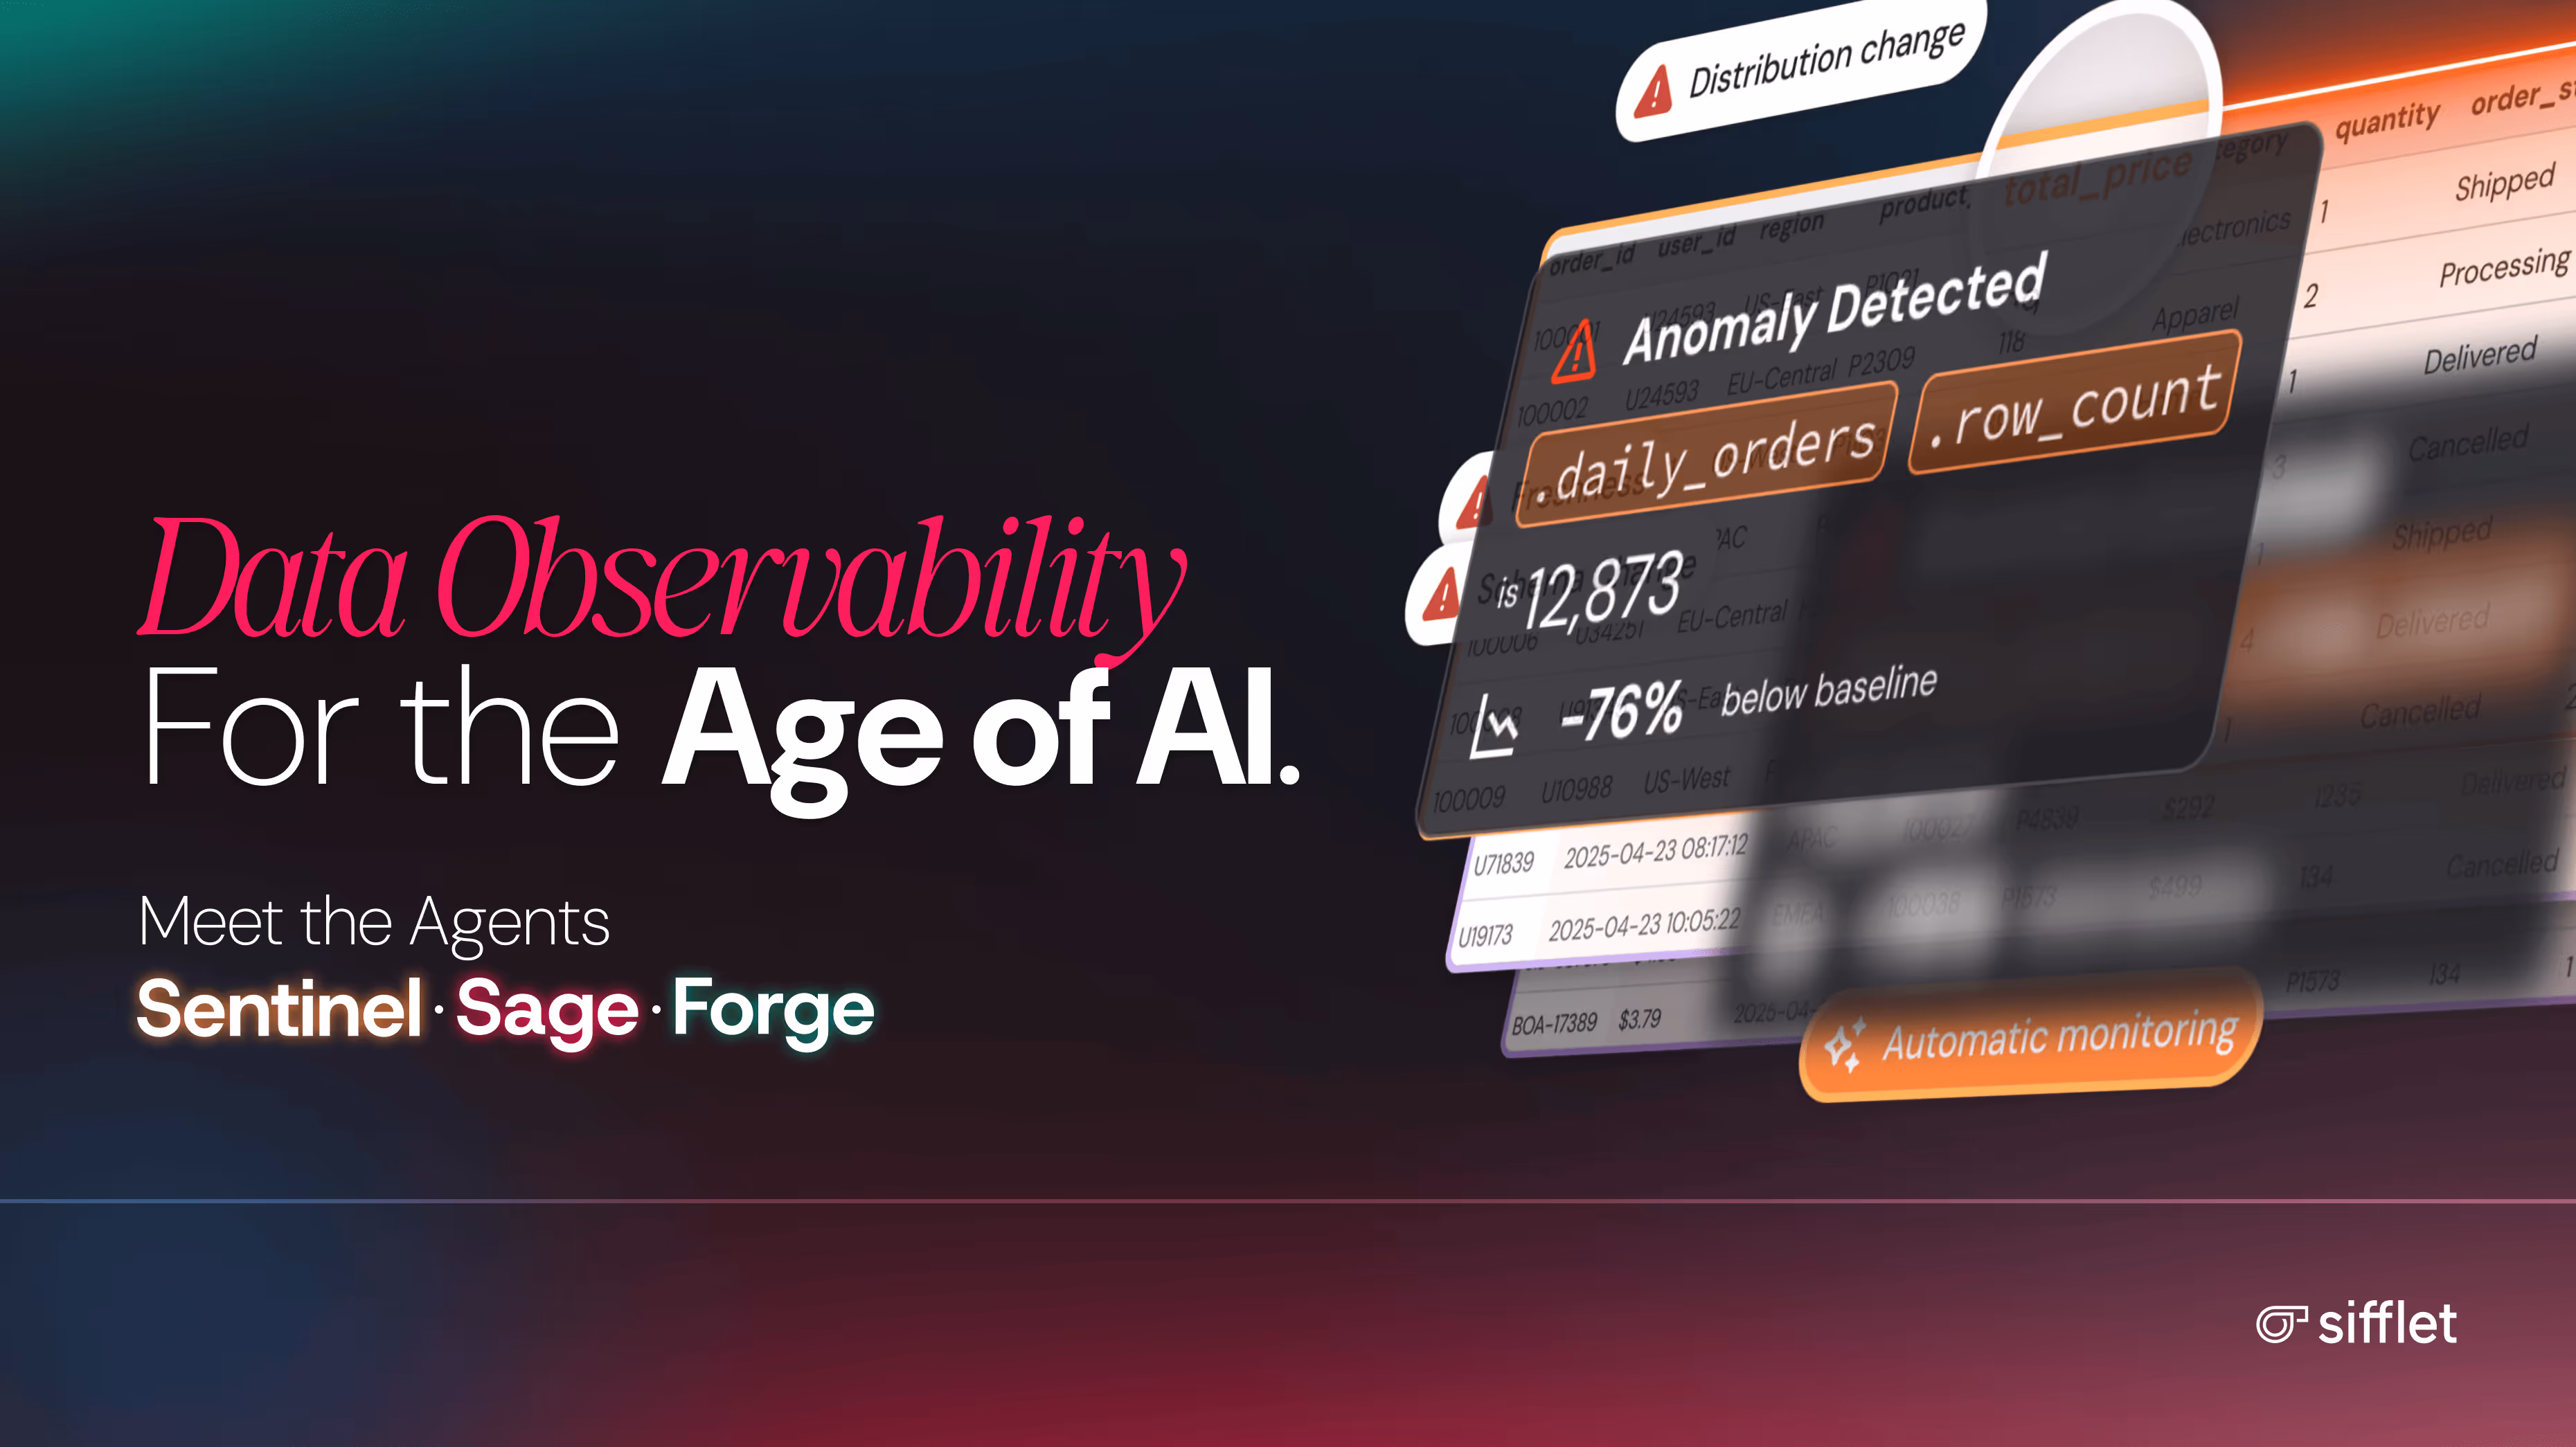
3. Proactive Auto-Monitoring with Sentinel
Sifflet uses Sentinel, an AI agent, to move assets from Not Monitored ⚪ to Healthy 🟢 by automating your entire monitoring strategy. Instead of writing thousands of tests manually, Sentinel analyzes your metadata and data samples to suggest ready-to-use monitors in seconds.
- One-Click Coverage: Sentinel generates recommendations for a single table, bulk selections from your catalog, or an entire Data Product simultaneously.
- AI-Powered Suggestions: Sentinel proposes monitors with clear statistical and logical justification, so teams understand why each check exists.
- Human-In-The-Loop: Approving AI-suggested monitors moves critical assets from unmonitored ⚪ to Healthy 🟢 with minimal manual effort.
4. Business-Centric Data Products
Sifflet allows you to group assets into Data Products: groupings of datasets, dashboards, and tasks that serve a common business use case; e.g., global marketing performance.
Rather than tracking individual tables, Sifflet allows for monitoring functional business units in their aggregate. A failure in one or more underlying assets is weighted and reflected in the Data Product's overall health.
This macro perspective maps technical failures to their specific business impacts in a single view.
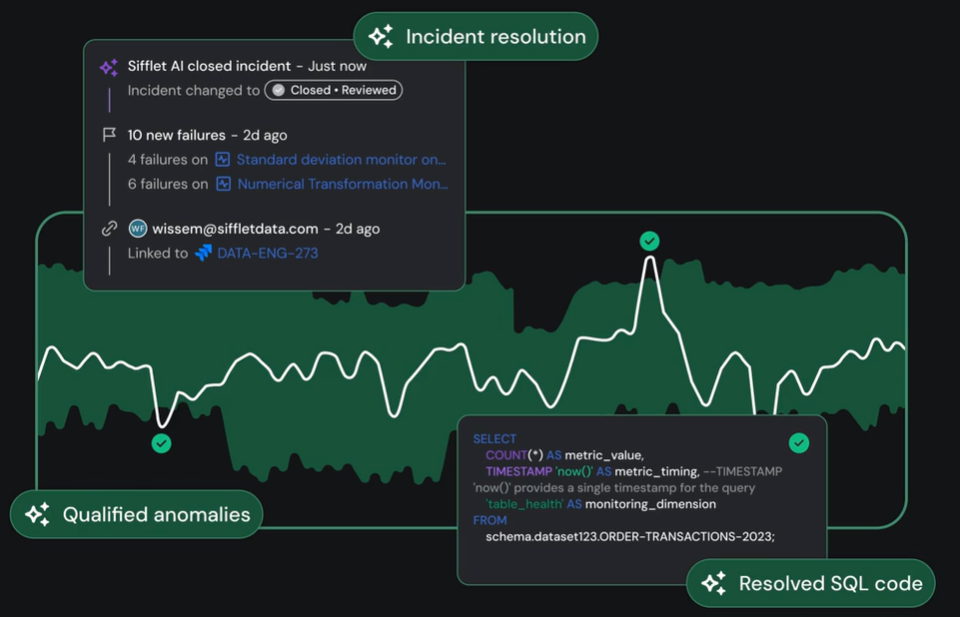
5. Closing the Loop: Triage to Resolution with Sage and Forge
When a High Risk 🟠 or Urgent 🔴 status appears, Sifflet's intelligence layer moves the team from a dashboard alert to a restored status.
- Sage builds a living archive of every incident and transformation to explain precisely where and why a break occurred. It consolidates scattered alerts into a single incident narrative that maps technical dependencies to their business impact.
- Forge suggests a tailored fix based on previously successful resolutions to quickly restore reliability.
6. The Executive View: Sifflet's Asset Page
Maintaining trust at scale requires a bird's-eye view of your entire data health. Sifflet displays every monitor and data product in one place: the Asset Page.
At the executive level, this trust model becomes measurable and governable through a customizable set of system-level indicators:
- Table Uptime: A KPI representing the percentage of tables within a specific domain or Data Product that currently hold a Healthy 🟢 status.
- Monitor Coverage: A KPI tracking the percentage of your total data assets protected by at least one monitor, helping teams proactively eliminate blind spots.
- Custom Health Scores: A framework for bespoke reliability formulas that give weight to incidents by business importance to prioritize what matters most.
- Trend Analysis: Beyond the current status, Sifflet tracks health history to visualize the reliability of a data product over time.
- Clear Accountability: The Asset Page bridges the gap between technical failure and business ownership by displaying metadata tags and assigned owners, so the right team receives notification the moment a score drops.
Sifflet's Observability Health Score
An Observability Health Score delivers decision-grade confidence at a glance. It compresses all the technical signals into a single, continuously updated answer to the most business-critical question anyone can ask:
Is this data safe to use right now?
That's how data trust moves from aspiration to operating reality.
Don't wait for the next boardroom question to wonder if your data is compromised.
Book a demo today and see how Sifflet can make data trust observable and actionable in your enterprise.


-p-500.png)
