


76% of organizations have now implemented data observability. If you’re in the remaining 24%, this is what you’re missing.
Here are 7 use cases and real-world case studies that demonstrate how companies can fuel revenue growth, reduce risk, protect margins, and govern AI through data observability.
Executives, you’ll want to take a look at his.
What Is Data Observability?
Data observability is the process of monitoring the health and quality of data as it moves from its source through pipelines and transformations into reports, models, and applications.
Its value to data teams is unquestioned. But for those operating on the business end of things, or from the corner office, data observability might sound more abstract than advantageous.
These real-world use cases make the value unmistakable. Each one shows how observability turns data reliability into bottom-line impact.
The 7 Best Data Observability Use Cases
When analyzing how execs can actually use observability, it’s best to employ real-life scenarios.
We’re not talking about hypothetical scenarios, we mean facts.
Let's begin with the most common challenge every growing enterprise eventually confronts: monitoring at scale.
1: Enterprise Scale Monitoring
At some point, it's sheer volume and complexity that turn data reliability into more of a statistical outcome than a measure of operational discipline.
Regardless, the end result is the same: reliability wanes, and consequential decisions begin to rest on data that may no longer reflect reality.
For example, Etam had just finished modernizing its stack with Snowflake and dbt. Yet, with thousands of interdependent assets powering everything from pricing to forecasting, unseen data issues were slipping through the cracks.
Etam deployed data observability and was up and running in days. Upon mapping its surroundings, the platform noted familiar retail patterns: slower Mondays, midweek activity bursts, and merchandising swings stemming from the release of new styles and collections.
As expected, the platform began suggesting targeted testing that the data team could store as version-controlled rules alongside dbt models.
With those in place, observability shifted from configuration to continuous detection, catching issues as they emerged but before they proliferated.
How did impact the business?
- AI-driven alerts flagged volume and distribution anomalies before they rolled into business decisions
- Issues surfaced earlier in the pipeline, reducing time to insight and shortening decision cycles
- Snowflake ROI improved by identifying and eliminating wasted compute time
- Business logic monitoring strengthened pricing integrity and stock accuracy
With observability, Etam was able to keep pricing accuracy, influence inventory decisions, and reduce expensive cloud compute costs.
2: Incident Response Optimization
Nothing drains an IT budget faster than everyone stopping what they are doing to chase the same recurring issues.
Context switching, duplicated checks, and chatting across numerous Slack threads disrupt daily work.
The real problem is that no one knows who's actually responsible for resolving a particular data incident.
Nextbite operates a virtual restaurant platform that ingests first-party and third-party data from multiple external partners.
Before deploying observability, incident management lived in a dedicated Slack channel supplemented by dbt tests. The process worked at a small scale, but as data volume grew, so did the number of failures. According to the Director of Data Engineering, it became "an unnecessarily complex and time-consuming process."
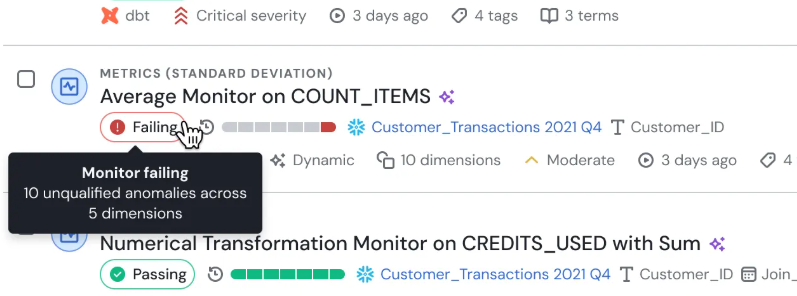
Nextbite deployed data observability to transform incident response from a pull (teams scrolling Slack) to a push (automated detection with clear ownership).
The platform's Incident Management Reporting defined ownership for each issue:
"An essential feature and a key differentiating factor," according to the director.
ML-powered monitoring learned the cyclical patterns in restaurant industry data and performed quality checks in minutes, rather than following weeks of custom SQL development.
When data issues surfaced, they were automatically flagged, routed to the responsible owner, and contextualized with the information necessary to act on and resolve them quickly.
After implementing data observability:
- The team eliminated manual error tracking, saving ~3 hours per week in Slack scrolling
- Data provider issues identified 1-2 per week on the day they occurred, rather than days later through ad-hoc checks
- Observability spotted and resolved most issues before they could reach and interrupt data users
- The engineering team deployed ~80 advanced monitoring rules in minutes; work that would have required weeks of custom development
Starting with automated detection and evolving into ownership-driven workflows, incident response became a cost-saving discipline. Observability returns valuable engineering hours to work that actually moves the business forward.
3. Root Cause Analysis
When data breaks, finding the source shouldn't feel like crime-scene forensics. Yet most engineering teams live this reality daily.
Adaptavist, a global technology consultancy based in London, operates a complex data ecosystem spanning multiple business units, multiple repos, and highly interdependent transformation layers.
When data quality issues surfaced, engineers needed days to trace failures given the environment's inherent complexity.
They had to navigate nested SQL, opaque transformations, and fragmented codebases. And with a shift from monorepo to polyrepo underway, these blind spots risked multiplying without a more transparent system.
Adaptavist deployed data observability to replace guesswork with guided investigation.
The platform automatically mapped data from source to consumption, including across the new polyrepo architecture, creating a live, end-to-end causal chain.
Automated data lineage and metadata-assisted analysis surfaced the most likely failure points, shrinking the search space from dozens of models to a single transformation.
Each incident arrived with upstream lineage, affected models, impacted business assets, and the exact point where behavior diverged.
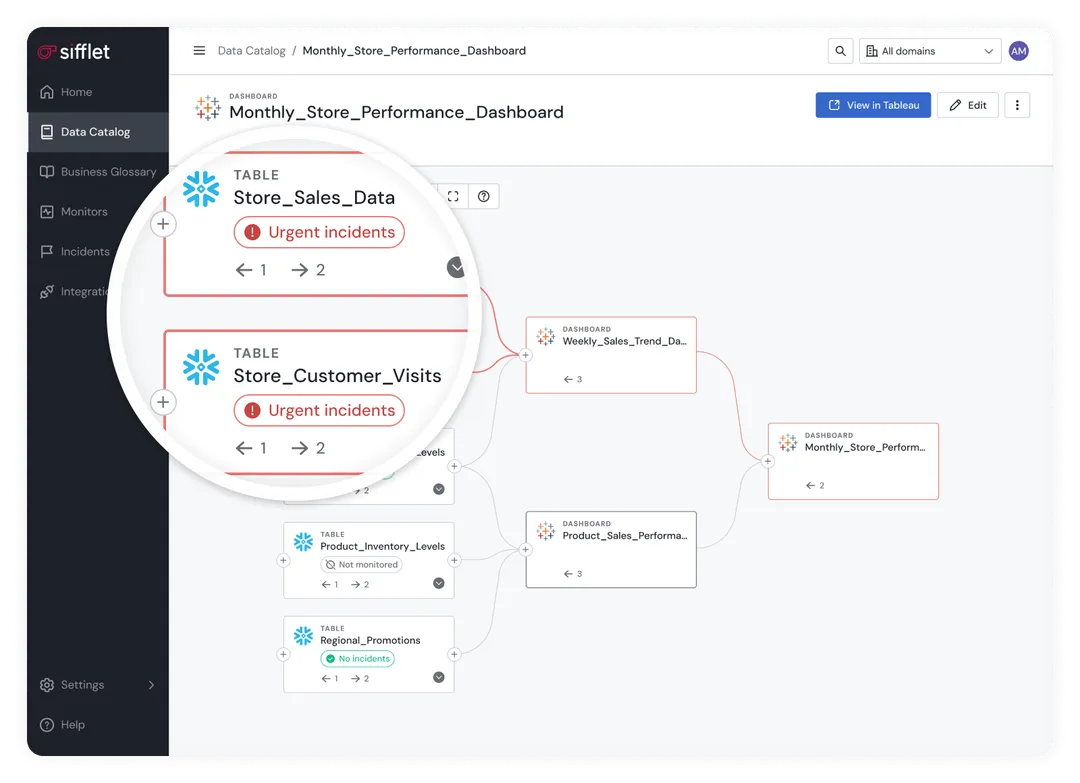
Engineers no longer sifted through logs or chased symptoms across repos.
Lineage linked physical tables to SQL logic and dbt models, making the “first wrong turn” immediately visible.
Observability also accelerated the validation stage. Instead of writing bespoke Python tests to confirm a fix, engineers used dbt tests-as-code to verify corrections within minutes.
How did it affect the business?
- Debugging time dropped from days to hours
- Hundreds of engineering hours returned to strategic development
- Testing cycles accelerated by 94 percent
- Refactoring efficiency increased by 92 percent
- Monorepo-to-polyrepo migration with full visibility
Root cause analysis becomes a systematic workflow instead of a forensic exercise. Observability gives engineers the clarity to fix issues fast and the time and freedom to build what the business actually needs.
4. Monetization of Data
You can negotiate pricing and timelines.
But you can't haggle over data quality when a customer is paying for your data.
In data monetization, trust is the product. And trust requires evidence.
Carrefour, a €90 billion global retailer, launched Carrefour Links to commercialize its first-party shopper data from across 40 countries and 12,500 stores.
Their customers include the world's largest CPG brands all of which expect data that is accurate, timely, and fully traceable.
The challenge wasn't ambition. It was scale.
Carrefour Links needed a way to guarantee that:
- Data remained consistent across markets and channels
- Anomalies were caught before reaching their clients,
- Engineering time wasn't consumed by manual data validation
- Every insight delivered could withstand external scrutiny
Carrefour deployed data observability as a dedicated quality assurance layer for its data commerce business. The platform consolidated lineage, quality rules, and incident management into a unified system, bypassing tool fragmentation and eliminating manual verification.
The key to scaling was automated quality checks.
Using templates and quality-as-code, Carrefour could deploy monitoring across any market or product without wrangling with custom SQL. This simplified the challenge of scaling across 8+ countries without increasing headcount.
This resulted in:
- A verifiable "trust layer" that external clients could rely on
- 800+ assets monitored without proportional engineering headcount
- 100+ collaborators empowered with quality scores and lineage visibility
- Revenue protected by preventing inaccurate insights from reaching paying clients
- 80% reduction in test maintenance overhead
Monetizing data requires ironclad certainty. Observability delivers that certainty, safeguarding revenue, preserving client confidence, and reducing operating costs across diverse markets.
5. Cost Observability
Your cloud bill doesn’t spike because of data volume. It spikes because of inefficiency you can’t see.
Pipelines run long after their usefulness expires. Transformations materialize dimensions no one uses. Queries scan entire datasets before applying filters.
When you can’t see what consumes compute, optimization turns into guesswork.
And guesswork is expensive.
A global financial services firm with 50+ analytics teams saw its Snowflake spend rise from $100K to $280K per month in less than two years. Finance assumed the cost curve was a natural byproduct of growth.
Engineering leadership wasn’t so sure.
Once they finally investigated, the root issue became obvious:
Three analytics groups materialized their own versions of the same customer dimension. 15% of compute gone to duplication.
Dashboards performed complex joins on entire tables, filtering only after processing millions of rows.
Legacy jobs from past initiatives still ran daily, despite no active consumers.
Development workloads mirrored production, consuming production-level compute for testing.
The real problem was not waste itself; it was invisibility.
The firm deployed data observability to make cost transparent.
Instead of a single line item like “Snowflake: $280,000”, teams could finally see which pipelines, queries, and assets consumed the most compute.
Lineage and utilization insights showed which datasets were actively used and which were dead weight. Anomaly detection flagged unexpected spikes before they appeared on the monthly bill.
The impact was noticeable:
- Cloud compute spend fell by 40% ($280K → $168K/month)
- Redundant data assets were identified and consolidated
- Inefficient query patterns were revealed and optimized
- Unused pipelines were retired, eliminating recurring waste
- Spikes in consumption were detected early instead of showing up on invoices
- Cost attribution across business units became accurate and defensible
Observability exposes the hidden inefficiencies that quietly inflate cloud bills. When you can see what drives cost, you can manage it. And when cost becomes a controlled variable instead of a surprise, cloud economics finally work in your favor.
6. Data Governance
Self-serve analytics only works when governance is fully present. Business teams need the freedom to explore data, and stewards need the visibility and control to keep that exploration safe.
BBC Studios wanted to scale self-service analytics while protecting sensitive content and revenue data. Static documentation couldn't keep up with continuous change in a large cloud environment, so the BBC implemented data observability as the foundation for governance-by-design.
Data observability operationalized data governance across the business. Lineage was mapped automatically for critical assets, giving stewards a live, accurate view of how data moved through transformations and into consumption.
Instead of relying on policy documents, targeted quality checks enforced governance standards. Controls stopped bad data from reaching business users while still giving teams the freedom to explore, albeit within established guardrails.
The benefits were immediate: business users gained the freedom to help themselves, while stewards retained control. Self-service analytics became scalable and safe.
But there were other impacts:
- 50+ business and technical users supported with live governance visibility
- 139 critical assets automatically mapped and continuously monitored
- 87 automated quality checks enforcing governance rules (70 marked critical)
- Self-serve analytics expanded without increasing governance headcount
- Regulatory requirements are enforced through the platform instead of manual audits
Self-service only scales when governance is a bridge and not a barrier. Observability embeds the controls that keep data compliant while allowing data users to move at the speed the business demands.
7. AI Governance and Reliability
Machine learning models are only as reliable as the data that trains and feeds them. When upstream data drifts, so, too, will your models.
A global consulting firm relied on machine learning models to support decisions in sales, finance, HR, and workforce planning. Their pipeline integrated data from multiple business systems, each of which changed independently via new taxonomies, shifting business units, and modified vendor schemas.
The fragility was real.
At one point, a key feature driving an ML model fell to zero inside the warehouse. Nothing upstream signaled the problem. No alert. No schema clue. Just a silent break.
In another case, placeholder values were inadvertently included in a feature set. If that had reached production, it would have skewed predictions with no one the wiser.
As one senior data scientist put it: "Our upstream changes constantly. We need to know the moment something shifts."
The firm introduced observability across the entire ML pipeline.
Automatic profiling created baselines for every critical feature. Raw data checks flagged upstream errors early, and validation at each transformation step ensured intermediate outputs behaved as expected.
Real-time drift detection caught distribution changes, missing values, and unusual patterns as they happened. No vague alerts; just transparent reporting showing exactly what changed and where.
Issues now surface immediately, rather than through model reviews or after users notice odd behavior. Just as critical, the model owners knew what had broken with the time to intervene before prediction quality slipped.
With observability embedded in their ML governance process:
- Feature drift and upstream schema changes were detected before they affected model performance.
- Data issues were identified early in the pipeline rather than discovered through broken predictions.
- Data scientists focused on experimentation and improvement rather than reactive debugging.
- Model reliability improved despite constant upstream change.
- Stakeholders trusted predictions because the system showed why the model outputs remained reliable.
Model reliability means catching drift early. Observability surfaces changes as they happen, protecting trust in the data behind every decision.
Choosing the Best Data Observability Tool
The question isn't whether you need observability. It's whether the platform you choose can deliver business impact. That requires metadata intelligence, automation, and AI working together in a single system.
Sifflet brings quality monitoring, lineage, catalog, and ownership modeling into one system. This unification replaces the swivel between tools and gives everyone a shared view of how data flows, who owns it, and what each asset powers.
This metadata control plane is the backbone for every use case in this article.
Agentic AI Designed for Real Workflows
Sifflet's AI agents interpret metadata, accelerate investigation, and guide remediation.
Sentinel proposes monitors and surfaces meaningful anomalies. Sage performs root cause analysis with full lineage context. And Forge recommends remediation steps and workflow actions.
AI Agents reduce manual triage and shorten the path from detection to resolution.
They give teams clarity while keeping human judgment at the center of every decision.
Business Context That Drives Action
Every asset inherits criticality, ownership, lineage, and business impact. That context allows teams to:
- Prioritize incidents based on revenue, customer commitments, or regulatory exposure
- Prove governance and monetization standards with evidence
- Provide reliability guarantees for AI systems and downstream decision-makers
Executives don't greenlight technology because it sparks joy. They greenlight it because it protects the business.
Data observability accomplishes both.
Discover the business outcomes your current data gaps are costing your business.
Book your Sifflet demo today and find the value hiding within your data estate.


-p-500.png)
