


Congratulations! Your system performance is excellent.
But your data quality? Not so much.
Splunk Observability Cloud is a strong APM platform. It keeps services alive and responsive. But uptime and latency don't guarantee data reliability or trust.
In fact, it doesn't even consider it.
Splunk's system-level telemetry alone leaves critical blind spots in your data layer.
That’s why we’re presenting five alternatives to Splunk Observability Cloud. Because a dedicated, end-to-end data-observability tool is a far better choice for data reliability and trust than an APM alone.
Wat is Splunk Observability Cloud?
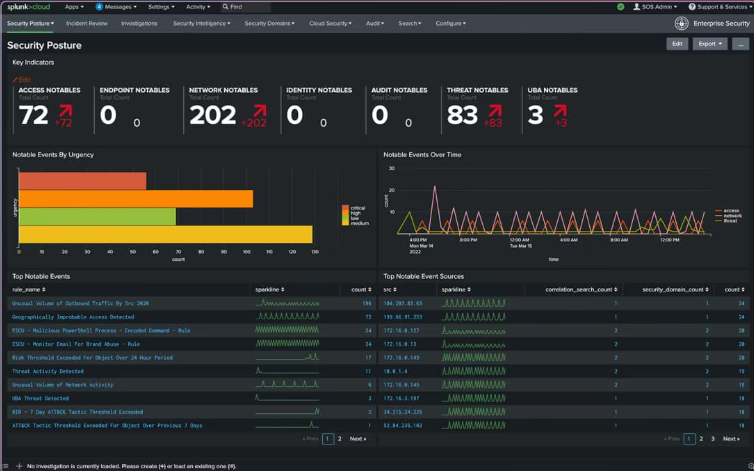
Splunk Observability Cloud (SOC) is a cloud-native, full-stack APM platform. The platform is a standalone component of a broader Splunk product ecosystem.
It has recently expanded beyond its original focus on log analytics to become more observability-focused as data observability has gained wider adoption.
The platform runs on OpenTelemetry, an open standard for collecting and formatting logs, metrics, and traces.
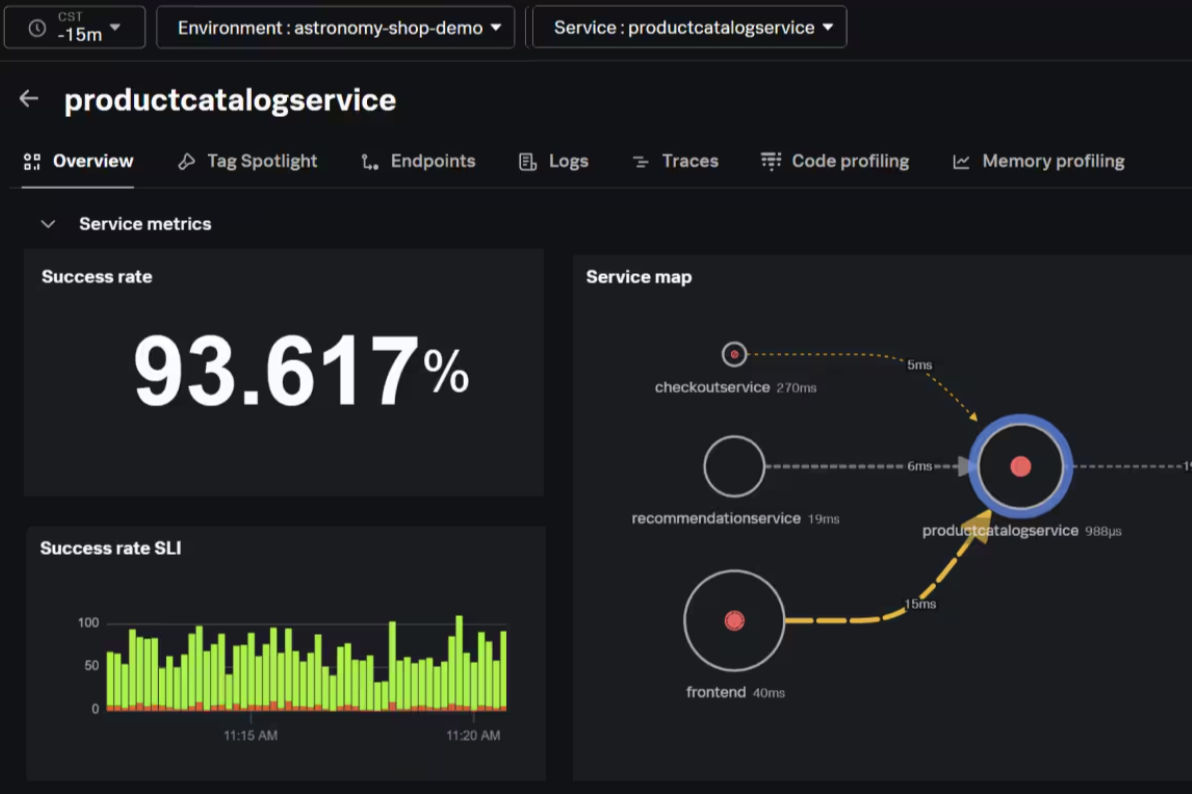
Using OpenTelemetry allows Splunk to ingest and correlate massive volumes of information from cloud and hybrid environments. These signals flow into a single workflow that maps service dependencies and highlights latency and performance bottlenecks.
Splunk's AI Assistant
Splunk introduced AI features, including an AI Assistant, in mid-2024. Their assistant acts as a generative AI co-pilot for SRE and DevOps teams, helping them troubleshoot and analyze system issues using natural language processing (NLP).
Their AI Assistant reviews logs, metrics, and trace data to identify likely root causes of application or infrastructure failures. It can also generate SignalFlow queries, a proprietary programming language used with Splunk's statistical computation engine, to analyze incoming data and create custom charts and detector analytics.
The assistant summarizes insights across APM, Infrastructure Monitoring, and Log Observer, and offers recommended steps to guide incident response.
Where Does Splunk Observability Cloud Create Gaps?
Splunk is fine for APM and infrastructure monitoring. But for end-to-end data observability? Not so much.
SOC leaves critical gaps. And, more problematically, it can prove a barrier to filling those gaps.
- Data quality isn't the focus
Splunk does not run quality checks so it cannot stop anomalies, unexpected nulls or distribution shifts.
Additionally, there freshness and volume are not monitored, so the platform cannot verify if pipelines deliver complete and timely data.
Splunk can’t trace dependencies from pipelines into warehouses and dashboards so it lacks cross-system lineage.
The end result is predictable. Data quality issues and anomalies surface only after they've distorted analytics or model outputs.
SOC leaves the data layer dangerously exposed.
- Heavy configuration required
Significant engineering effort is required to onboard the platform, which extends time-to-value.
SRE and DevOps teams will need to code, configure, and then maintain metrics for every microservice; work that requires deep expertise and ongoing dedication.
- Vendor lock-in concerns
Once an enterprise enters the Splunk ecosystem, it's difficult to escape. Licensing complexity, proprietary alert logic, and sticky integrations make escaping the Splunk world a considerable effort in both time and treasure.
- Walled garden vs. open source compatible
Integrating external tools to fill the Data Observability gap means rebuilding critical dashboards and alerts. This challenge is magnified by Splunk's use of the proprietary SignalFlow query language, which contributes to dashboard lock-in.
Overall, Splunk's operational gravity limits visibility and flexibility. And given the wholesale swing and miss at data quality and reliability monitoring, Splunk's claims appear more optics than observability.
Fortunately, there are strong alternatives that fill that gap.
The Best Alternatives to Splunk Observability Cloud
Teams that need visibility beyond system performance often pair or replace Splunk with platforms built for data observability, data quality, and end-to-end lineage.
The following tools provide more robust data reliability and greater flexibility as enterprises scale their data environments.
1. Sifflet, the Native-AI Data Observability Leader
⭐️⭐️⭐️⭐️⭐️ Ratings
G2 4.7/5 | Gartner 4.7/5
Sifflet is a Native-AI data observability platform.
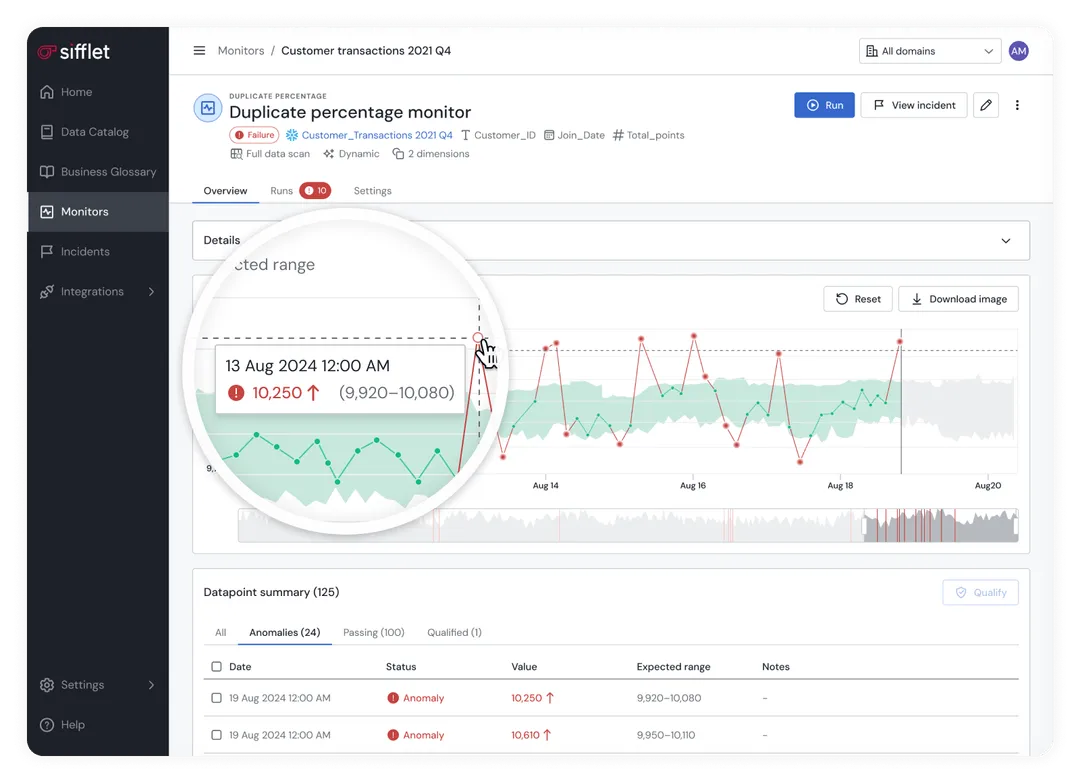
Unlike SOC's sole focus on system health, Sifflet doesn't skirt data quality and anomaly detection. In fact, the platform's mantra places data trust at the center of its operating priorities.
Sifflet delivers end-to-end visibility into the data layer. It monitors metadata across every stage of the data lifecycle and records how it moves from source systems through transformations into BI tools and downstream applications. This continuous lineage mapping gives teams clarity on where issues originate and which dashboards, reports, or models may be affected. It turns what is often a blind spot into a navigable, auditable system of record for data asset health.
More importantly, Sifflet is agentic to its core.
Its three specialized AI agents take the load off of engineering teams. Agents analyze metadata and system behavioral patterns. They use detailed data lineage to map upstream and downstream dependencies. And when data quality issues or anomalies occur? The AI Agents conduct root cause analysis to guide teams toward swift resolutions.
That's true agentic observability.
Finally, unlike many legacy platforms that rely on closed-source coding, Sifflet embraces open-source principles. This open-first architecture is critical for interoperability, allowing organizations to mix and match tools while keeping
Sifflet as a consistent data observability layer across all proprietary and open-source connectors.
Sifflet's features and capabilities
- Data health monitoring
- Trust Indicators across the stack
- Field-level lineage
- Self-serve observability
- Agentic Intelligence Layer
When to consider Sifflet over Splunk Observability Cloud?
Sifflet is the ideal choice if your team:
- Prioritizes proactive data asset reliability (quality, lineage, freshness) over application/system reliability.
- Needs to eliminate data downtime and ensure dashboards, reports, and analytics rely on trustworthy data.
- Works in Data Engineering, Analytics, or Governance and uses cloud platforms such as Snowflake or Databricks.
- Wants an automated, scalable solution that provides complete visibility from data ingestion through consumption.
Sifflet serves data-driven enterprises and mid-market organizations with mature data stacks that require complete transparency and visibility.
2. Datadog, the Full-Stack Cloud Observability
⭐⭐⭐⭐ Ratings
G2 4.4/5 | Capterra 4.6/5
Datadog is a cloud-native observability platform best for containerized, multi-cloud environments. It merges logs, metrics, traces (APM), real-user monitoring (RUM), infrastructure monitoring, and more into a single platform.
With a consolidated architecture, Datadog enables teams to correlate telemetry from various sources (logs, metrics, traces, user sessions) without cumbersome switching tools. This blending of infrastructure and end-user insight reveals system issues and performance bottlenecks in one place.
Datadog is preferable for its ease of use and relatively friction-free adoption. It features an intuitive interface, making it decidedly beginner-friendly. Datadog also offers pre-built dashboards and visualizations to get things up and running quickly.
When to consider Datadog over Splunk Observability Cloud?
Datadog is a better choice if your team:
- Needs one-stop monitoring across infrastructure, applications, and the user experience.
- Values ease of deployment and user experience over deep customization and ongoing lift.
Trade-off Consideration: Like SOC, Datadog excels at real-time infrastructure and application observability, but it's still not end-to-end data observability.
3. IBM Databand, the Pipeline Observability & Reliability
⭐⭐⭐⭐ Ratings
G2 4.4/5 | Capterra 4.5/5
Where SOC primarily monitors application services, IBM Databand is a data-observability platform built for pipelines, warehouses, and orchestrated workflows. It automatically collects metadata from jobs, runs, DAGs, and datasets.
Databand continuously monitors pipeline health, execution success, run latency, schema and volume changes, and other delivery KPIs.
When anomalies or rule deviations occur, such as missing data, late arrivals, or schema drift, Databand issues alerts before corrupted or delayed data reaches downstream systems.
Their specialty is guaranteeing Data Delivery Service Level Agreements (SLAs) by tracking key data delivery KPIs (e.g., Record Count, Null Count, and duration) and issuing alerts when data quality degrades. SOC monitors system SLAs, but doesn't confirm the accuracy of the data payload.
When to consider IBM Databand over Splunk Observability Cloud?
IBM Databand is the optimal choice if your team:
- Manages complex ETL/ELT environments with Apache Airflow, DataStage, or similar orchestrators and requires proactive pipeline SLA monitoring.
- Needs to detect data incidents before they reach the warehouse and corrupt downstream analytics.
- Prioritizes reliability of "data in motion" (pipeline execution) over "system health."
4. Acceldata, the Big Data Observability & Reliability
⭐⭐⭐⭐ Ratings
G2 4.4/5 | Gartner 4/5
Acceldata is an agentic data-management platform that brings together data observability, reliability, and cost/usage optimization into a single solution. Its target customers are companies operating large-scale data ecosystems with data lakes, warehouses, and distributed data pipelines.
Acceldata offers multidimensional observability across the data layer, infrastructure, pipelines, and cost. It monitors data delivery from ingestion through transformation to consumption.
It tracks delivery KPIs, data quality signals, and infrastructure resource usage.
But Acceldata goes beyond passive monitoring. Its "Agentic DM" architecture layers AI-powered agents to detect anomalies, identify root causes, and suggest optimizations. Spend-intelligence and resource-usage dashboards provide data leaders with visibility into costs and performance, enabling chargeback, cost control, and capacity planning.
When to consider Acceldata over Splunk Observability Cloud?
Acceldata is optimal if your organization:
- Manages massive, multi-petabyte data ecosystems where performance optimization and cost control are critical business concerns.
- Needs to tie data quality directly to infrastructure performance and cost metrics.
- Requires predictive observability and AI-driven anomaly detection beyond stiff, rule-based monitoring.
5. Bigeye, the Automated Data Quality Monitoring
⭐⭐⭐⭐
G2 4.5/ | Gartner 4.4/5
Bigeye is a data observability platform that monitors data pipelines, warehouses, and analytics assets rather than infrastructure or application telemetry.
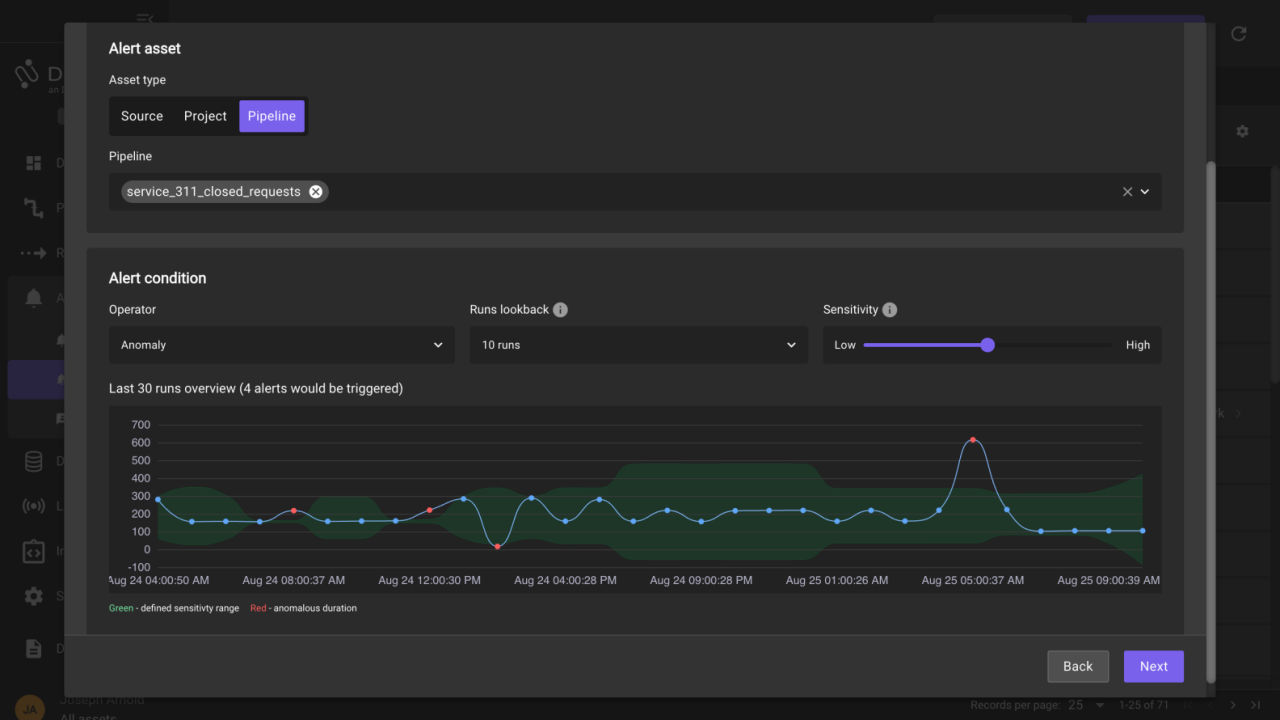
Its automated monitoring features (Autometrics / AutoThresholds) profile datasets and compute dynamic, historical baselines for quality metrics such as freshness, volume, schema, and distribution.
That eliminates the need to configure thousands of custom quality checks manually.
Bigeye tracks data lineage and dependency graphs, monitors data product health end-to-end, and issues alerts when anomalies or rule deviations occur. This effort provides early warning of data quality issues before they affect analytics or business decisions.
When to consider Bigeye over Splunk Observability Cloud?
Bigeye is the optimal choice if your enterprise:
- Prioritizes automation and ease of use for data quality monitoring over manual configuration.
- Lacks the engineering bandwidth to write and maintain thousands of manual data quality checks.
- Needs a dedicated solution that provides immediate visibility into data asset health (quality) rather than application health (APM).
From Monitoring to True Data Observability
Splunk Observability Cloud is all about system health and infrastructure telemetry.
But that focus leaves the data layer exposed.
That means dashboards, models, or reports run smoothly, but not reliably. Monitoring tells you when systems falter. Observability tells you when data itself breaks.  
For any data-driven enterprise, that difference is critical. If you care about business insight, not just uptime, you need more than telemetry.
You need data observability.
Sifflet, with its data-first, metadata-aware, AI-native design, represents that next level.
Ready to move beyond Splunk's limitations?
Discover how Sifflet's AI-native data observability can power your analytics with trusted, reliable data.


-p-500.png)
