Anomalo Shopping List
Machine learning? ✅
Low-friction set-up? ✅
Clean, easy-to-use UX? ✅
End-to-end observability? ❌
If Anomalo made your shopping list, this guide can help you decide whether to add it to the cart or put it back on the shelf.
We share insight into what it does well, where it comes up short, and 5 Anomalo alternatives that might be a better fit for what you need.
Before you check out, let’s take a closer look at what Anomalo brings to the table.
All About Anomalo
One of the more recognizable names in data quality monitoring, Anomalo offers broad anomaly detection without the manual lift.
Its appeal is unmistakable: connect the platform, choose your tables, and watch it work.
Anomalo's unsupervised machine learning determines what "normal" looks like, and then goes to work scouring for quality issues and flagging shifts in volume, structure, and distribution. In large analytical environments, that low-friction set-up is what puts Anomalo on the shortlist for data quality monitoring.
Anomalo's Strengths
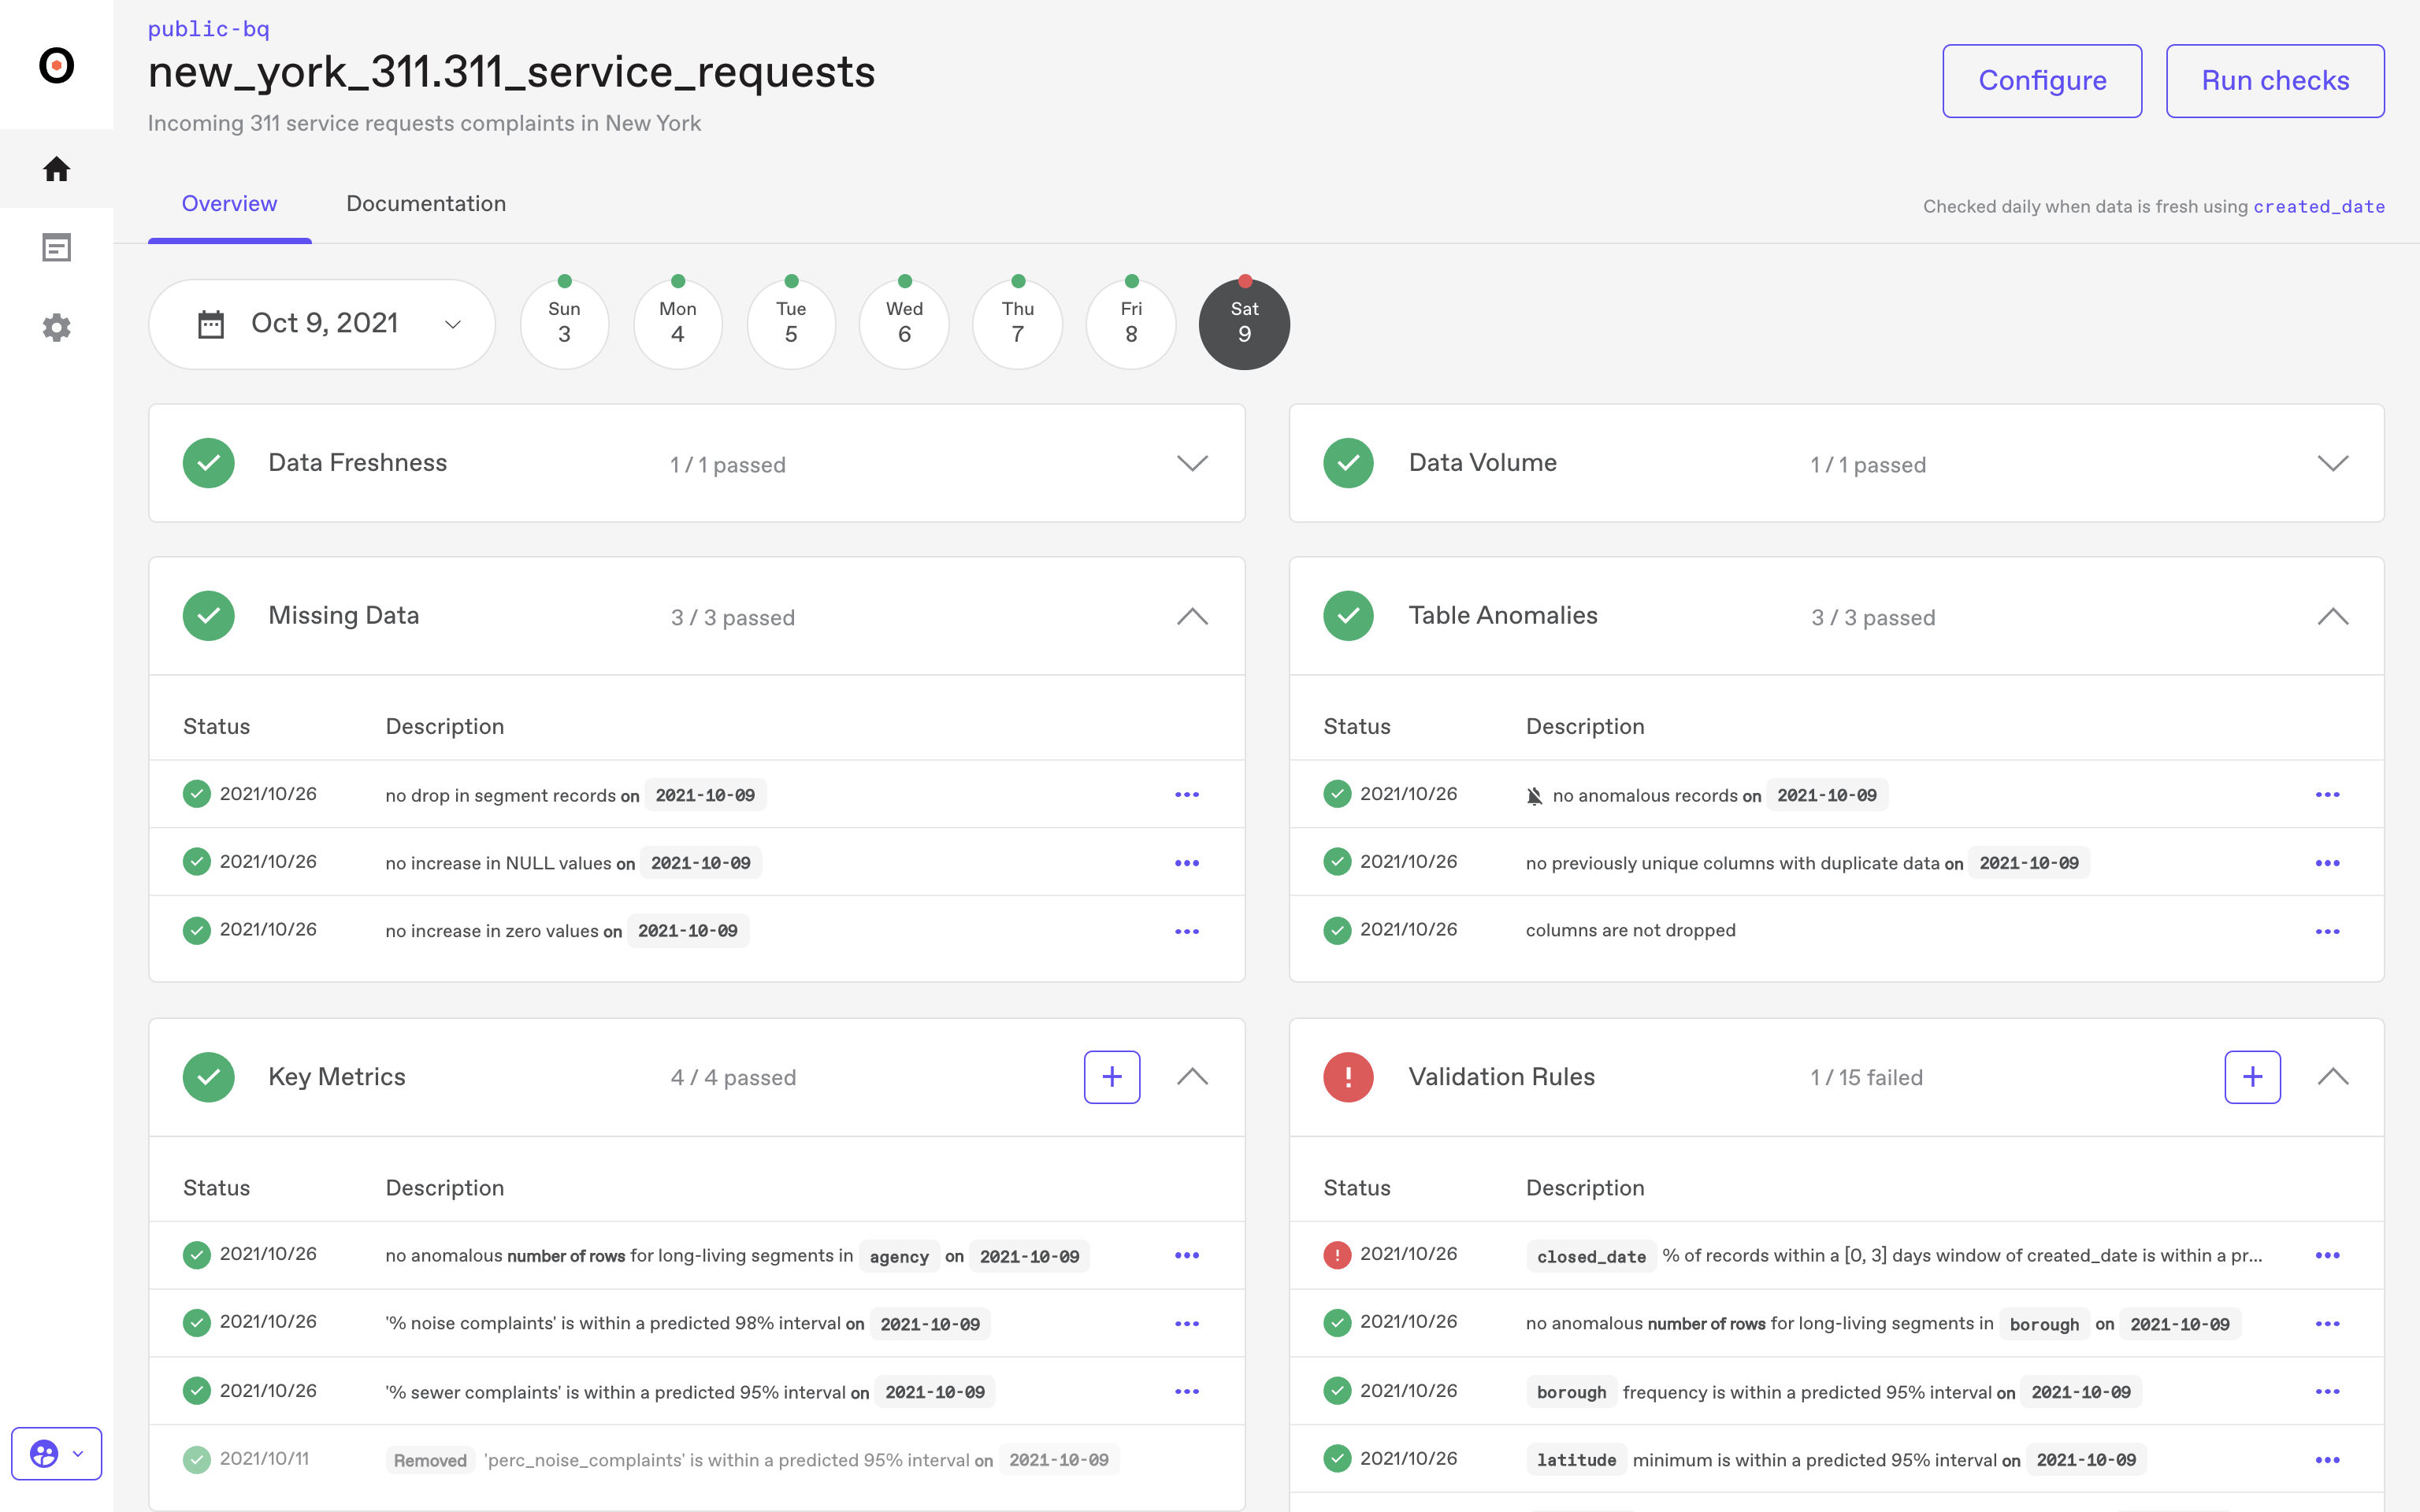
Anomalo’s best feature is arguably simplicity.
It doesn't require manual threshold setting, manual rule creation, or custom validations. It learns on its own.
This hands-free operation is a noteworthy advantage, providing broad visibility across thousands of tables with minimal human effort required in return.
The interface is clean and easy to use. Incidents, affected fields, sample records, and summary statistics are all reviewable in one spot. And, enterprise controls like RBAC, audit logs, and SOC 2 support check off most prerequisites on operational checklists for regulated industries.
Anomalo delivers dependable, automated data quality monitoring using its "learn the pattern, flag the change" model.
But it's not all roses and reliability.
Anomalo's Limitations
Simplicity is a double-edged sword.
Anomalo's core strength remains data quality at rest; analyzing and flagging issues after data has landed in the warehouse.
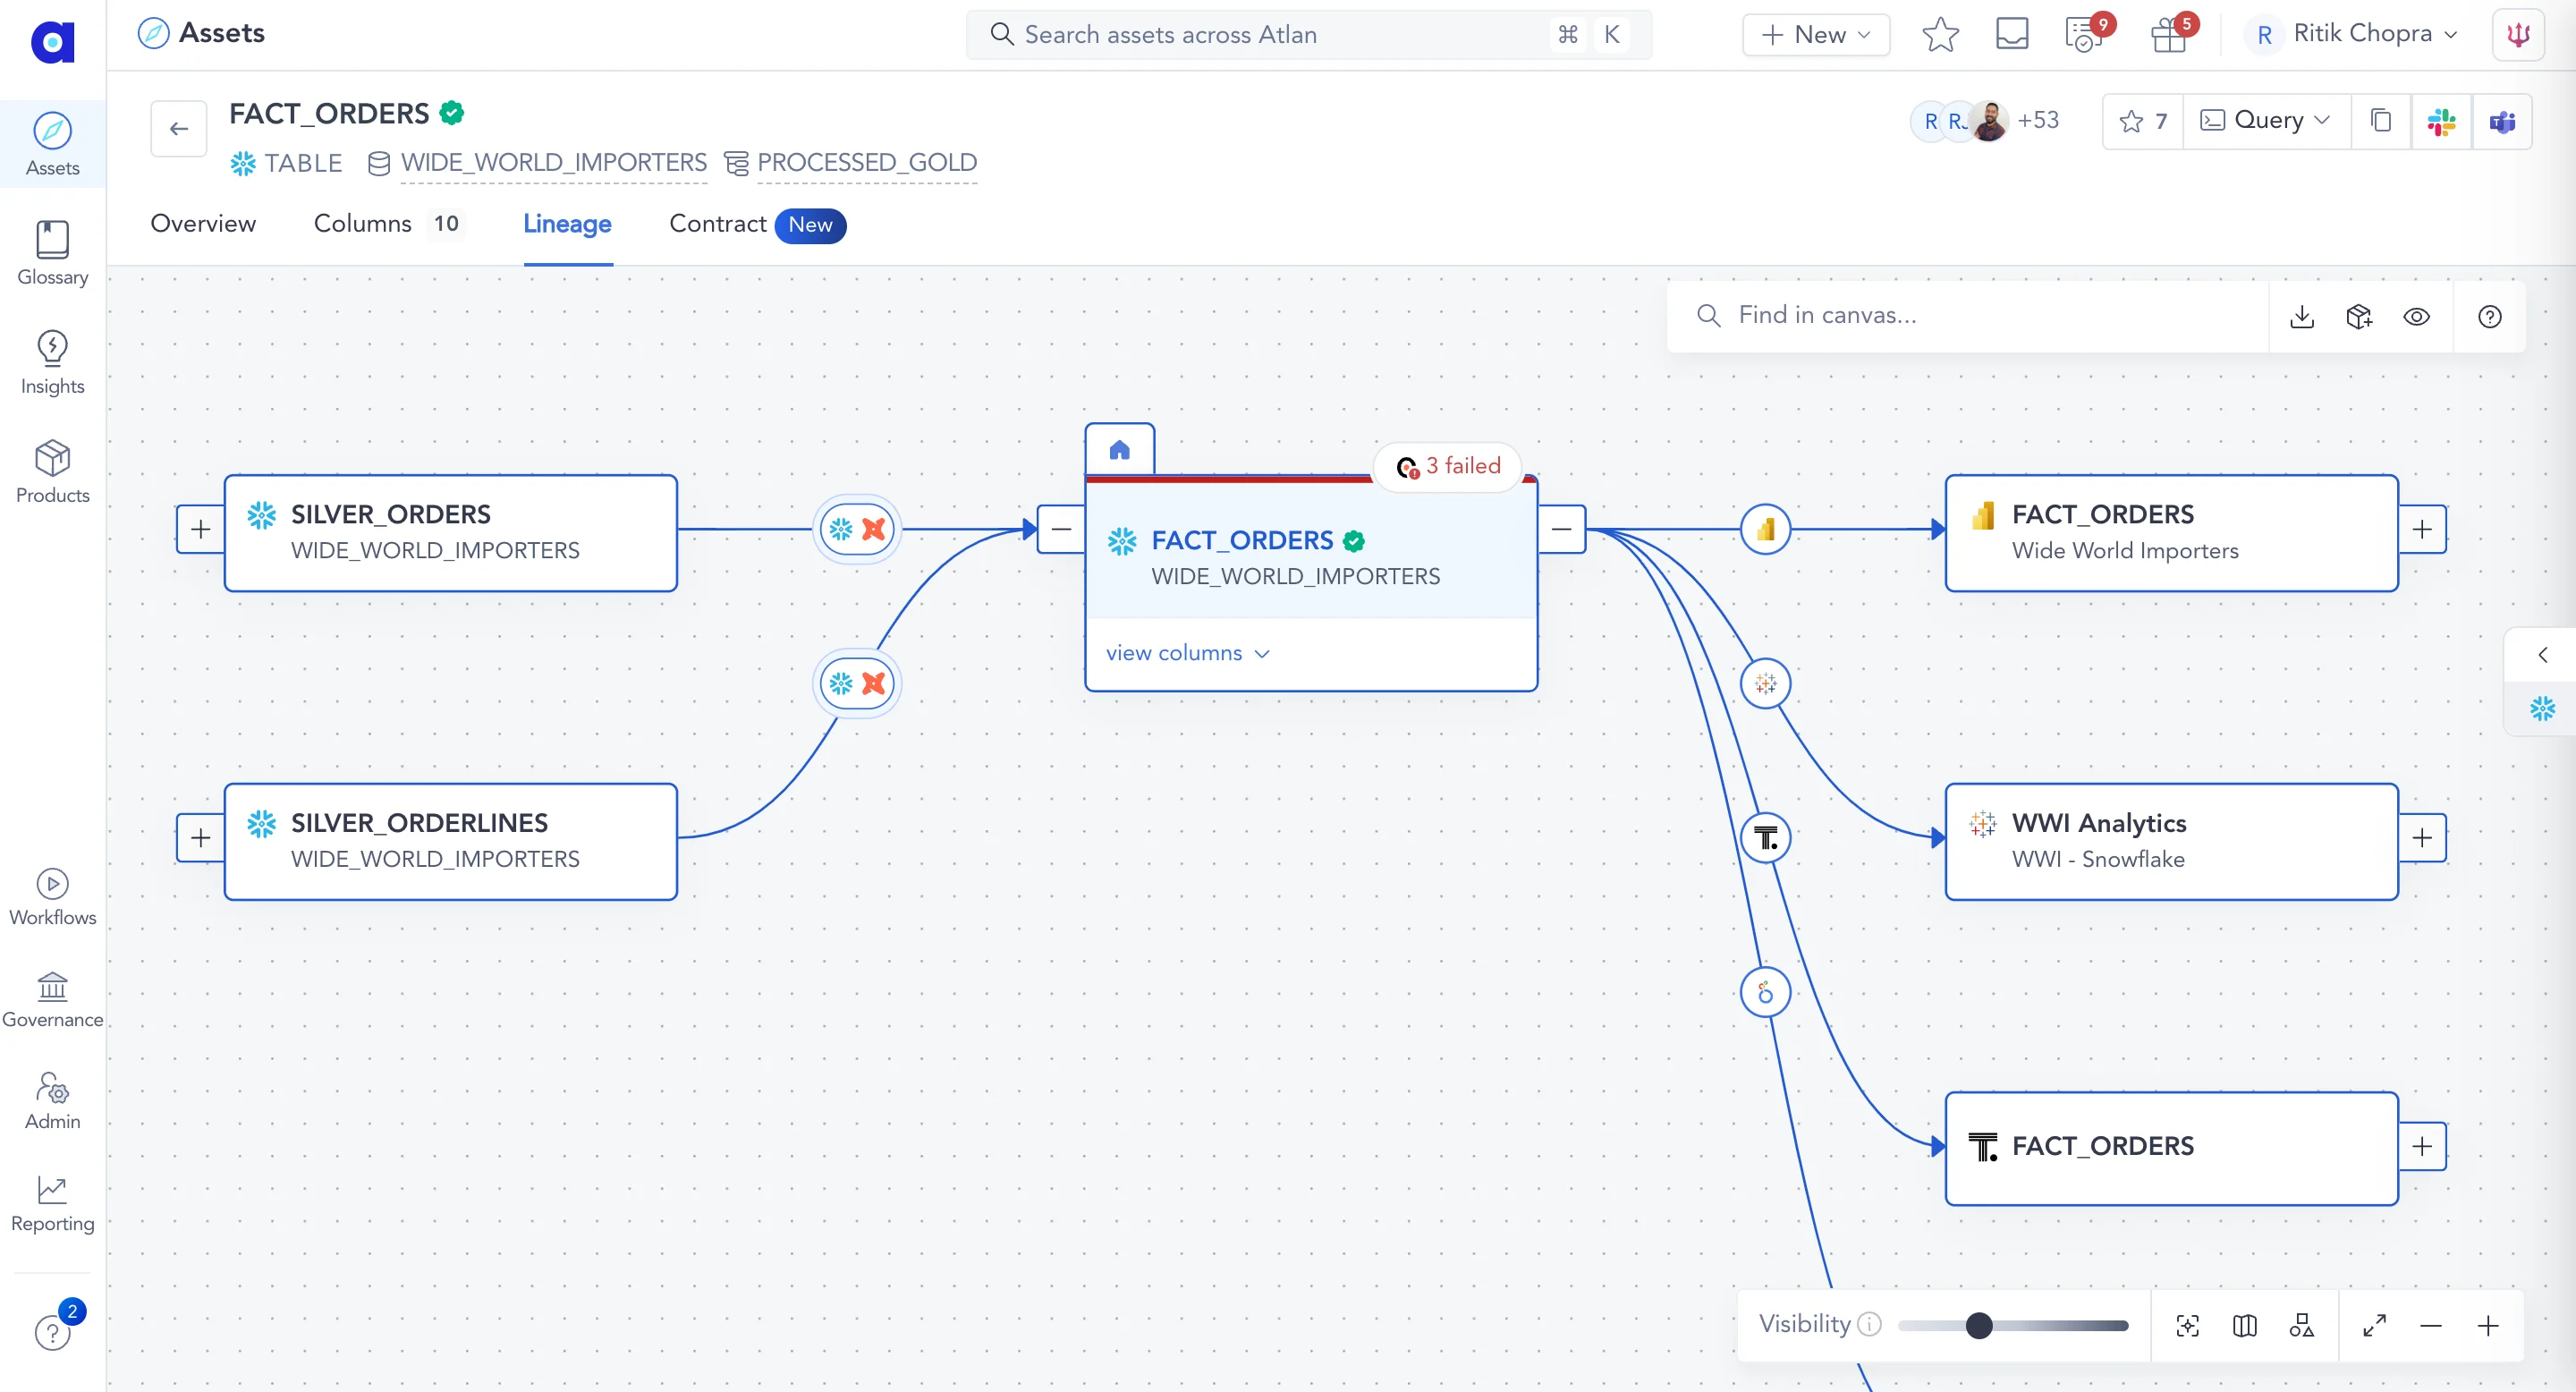
While it offers lineage and near-real-time checks to address downstream impact and quicker detection, it's not a full-service, end-to-end data observability tool.
Its ML-driven approach does relieve the burden of rule-writing; it's primarily an anomaly detection tool.
Yet enterprises that demand extensive domain-specific rules or policy enforcement across their entire workflow may find that Anomalo’s ML-first approach limits flexibility compared to rule-based systems.
Similarly, while its automated root cause analysis is serviceable, it's limited to the data within the warehouse.
Its lineage feature provides dependency mapping, but doesn't provide dynamic visibility into pipeline execution or workflow health like other workflow monitoring platforms.
Best Fit For Anomalo
- Companies using the warehouse as their primary source of truth
- Organizations with stable, predictable data flows
- Analytical environments with tables refreshed on a consistent schedule
- Groups preferring minimal manual set-up and configuration
Who Anomalo Is Not For
- Enterprises needing end-to-end pipeline monitoring before data reaches the warehouse.
- Environments where domain-specific validation or policy enforcement is essential
- Organizations demanding dynamic visibility into data workflow execution and pipeline health
If those were your requirements, Anomalo won't satisfy. You'll need a different platform purpose-built for deeper, end-to-end observability.
The 5 Best Alternatives to Anomalo
If you're looking for more, we present five platforms that fill in these gaps, from deeper lineage and operational insight to full-stack observability.
These are the 5 best alternatives to Anomalo.
Sifflet: AI-Native Data Observability
Rating ⭐⭐⭐⭐⭐
Sifflet offers what Anomalo doesn't: true end-to-end observability.
Sifflet monitors data quality and detects anomalies across sources, pipelines, transformations, and storage layers.
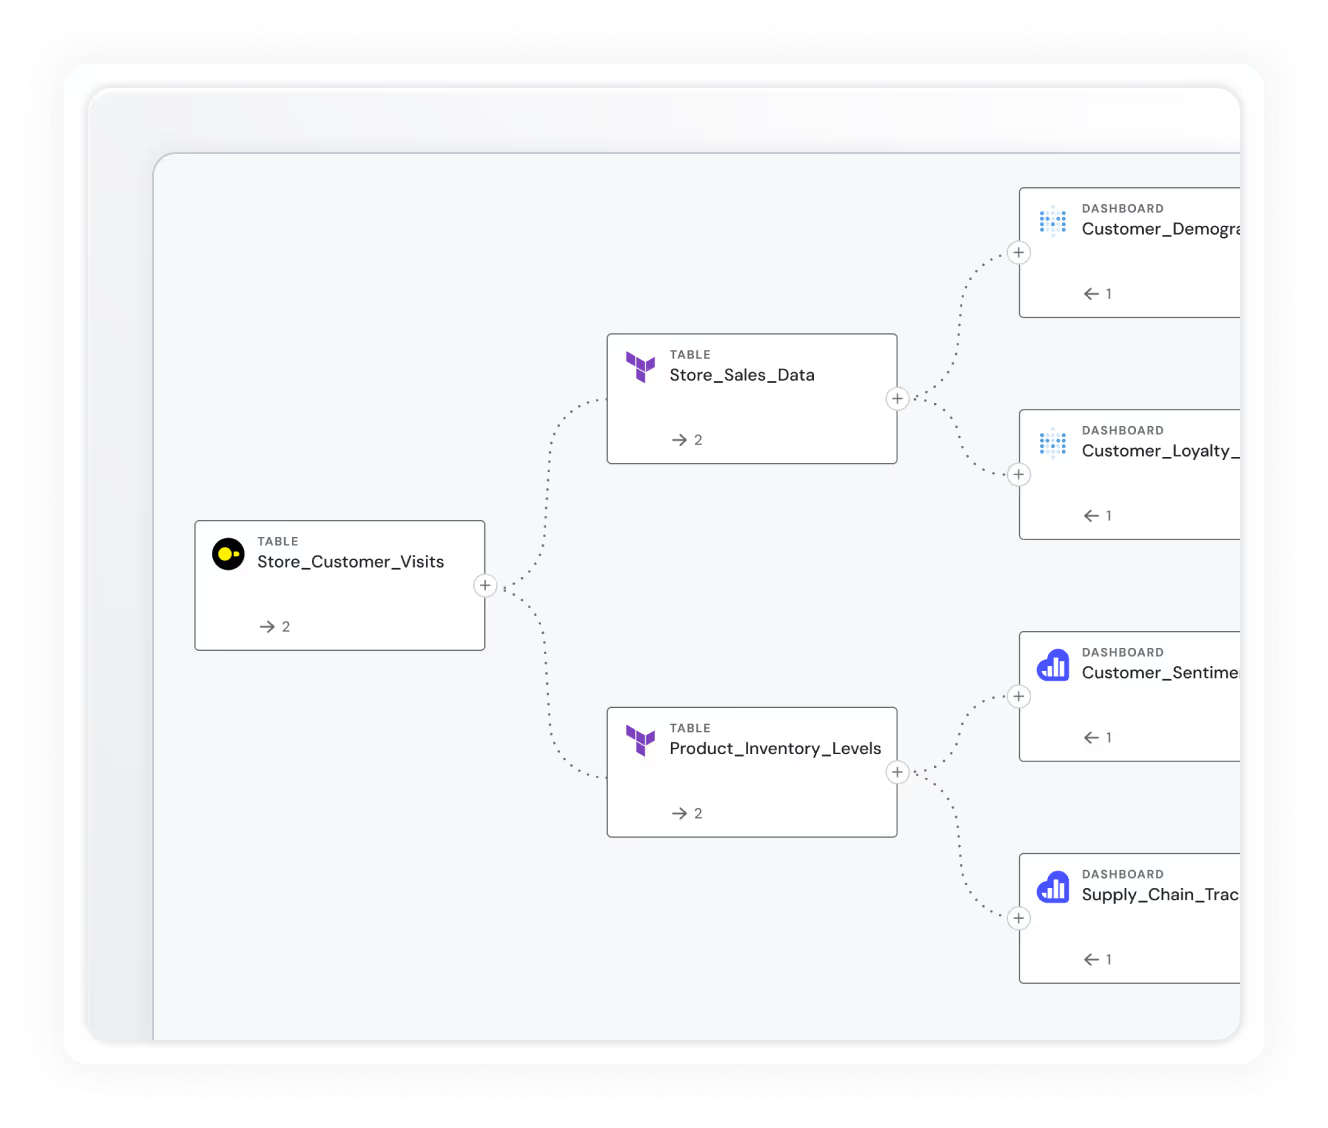
But it goes further. It tracks data all the way into the dashboards, models, and applications that consume it, mapping lineage across every step. That full-chain visibility is what turns detection into diagnosis, protecting dashboards, SLAs, and downstream decision-making.
The AI-native platform merges operational signals from pipelines, transformations, infrastructure, and consumption into one dynamic view.
Instead of painstakingly stitching insights together from multiple tools, users see where issues occur, what changed upstream, and which downstream assets and business functions are affected.
Sifflet's core benefit is operational clarity. It detects issues early, assesses their business impact, and guides remediation, with full context included with every prioritized alert.
And its powerful agentic capabilities mean AI agents automatically investigate incidents, isolating likely root causes, and surfacing the assets and owners involved in the resolution.
Key differences from Anomalo
- Active metadata architecture: Sifflet activates metadata to observe pipeline behavior, transformation logic, compute signals, and consumption patterns.
- AI Agents: AI Agents correlate signals across pipelines, transformations, and consumption to provide a broader view of root causes and suggested remediation steps.
- Operational, field-Level lineage: Sifflet monitors and maps pipeline behavior and transformation logic, offering field-level granularity
- Incident workspace: A centralized view combining lineage, prioritization, upstream events, ownership, and business context so teams can resolve issues without jumping between tools.
- Continuous pipeline monitoring: Sifflet monitors data and pipeline execution for continuous visibility
Why choose Sifflet over Anomalo
Choose Sifflet if your enterprise needs to understand root cause and business impact, not just detect warehouse-level anomalies.
Sifflet connects data, pipelines, and downstream consumers into one operational picture; something Anomalo simply isn’t built to do.
Acceldata Data Observability Cloud
Ratings ⭐⭐⭐⭐⭐
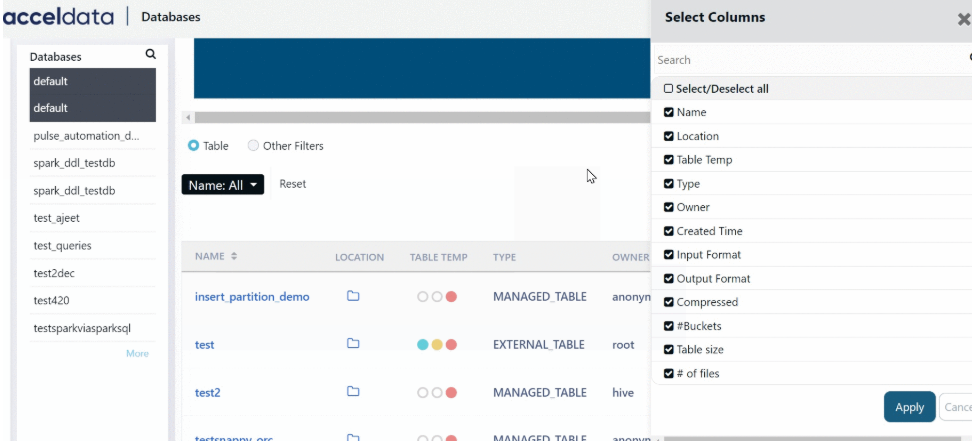
Acceldata delivers data observability over data, pipelines, and the infrastructure that powers them. The platform collects telemetry from execution engines, orchestration layers, and compute clusters, and correlates it with data quality metrics at the table and column levels.
This approach allows tracing incidents back to the resource, job, or bottleneck that triggered them.
But Acceldata goes beyond troubleshooting. Cost and efficiency are first-class signals.
Acceldata shows how compute consumption and resource usage shape pipeline behavior. It reveals inefficiencies that inflate spend or place SLAs at risk. Failure, latency, and resource contention patterns are raised in real time so operational teams can proactively keep systems flowing.
For organizations running complex, distributed, or cloud-heavy data pipelines, Acceldata provides a unified view, tying data reliability, infrastructure health, and operational spend together into a single dashboard.
Key Differences from Anomalo
- Infrastructure + data observability: Monitors compute behavior, job performance, orchestration events, and resource utilization
- Pipeline health visibility: Tracks failures, SLA breaches, and latency patterns across execution engines.
- Hybrid + multi-cloud awareness: Connects pipeline dynamics with compute usage and cost signals across cloud and on-prem environments.
- Operational context: Shows how resource conditions and transformation logic affect downstream data.
- High-volume processing support: Purpose-built for Spark, Hadoop, Kafka, and large-scale distributed processing environments.
Why choose Acceldata over Anomalo
Choose Acceldata when reliability depends on the systems that generate and move your data. If your pipelines are complex, distributed, or compute-intensive, Acceldata provides the full-stack operational visibility that Anomalo doesn't.
Monte Carlo
Ratings ⭐⭐⭐⭐⭐
Monte Carlo earns its place on shortlists by surfacing what broke and everywhere the impact lands. It tracks data as it moves across the stack, tracing every dependency so teams can intervene before downstream failures spread.
Freshness, volume, and schema checks run across both datasets and transformation steps, with lineage delivering a robust map of upstream causes and downstream dependencies.
Anomalo provides data quality checks for tables; Monte Carlo extends observability into feature pipelines and the behavior of training data.
Integrations with popular BI tools add further context on data quality by tracking dashboard freshness and usage, which are critical for analytics accuracy.

Key differences from Anomalo
- End-to-end lineage: Connects ingestion pipelines, warehouse tables, BI assets, and ML systems
- BI and dashboard monitoring: Monitors freshness and health in BI tools and analytics
- ML/feature oversight: Tracks training data, feature behavior, and drift in production models.
- Scalable: Handles large, distributed stacks with many interconnected data products and users.
Why choose Monte Carlo over Anomalo
Choose Monte Carlo when you need observability that spans pipelines, BI, and machine learning operations.
For enterprises that have large, interconnected data ecosystems, Monte Carlo provides the structured, end-to-end visibility that Anomalo can’t.
Datadog
Rating ⭐⭐⭐⭐⭐
Datadog has gained traction as data systems adopt the same distributed, service-centric patterns as modern applications. In environments where pipelines function like microservices and data flows run alongside APIs and services,
Datadog becomes the system of record for operational signals.
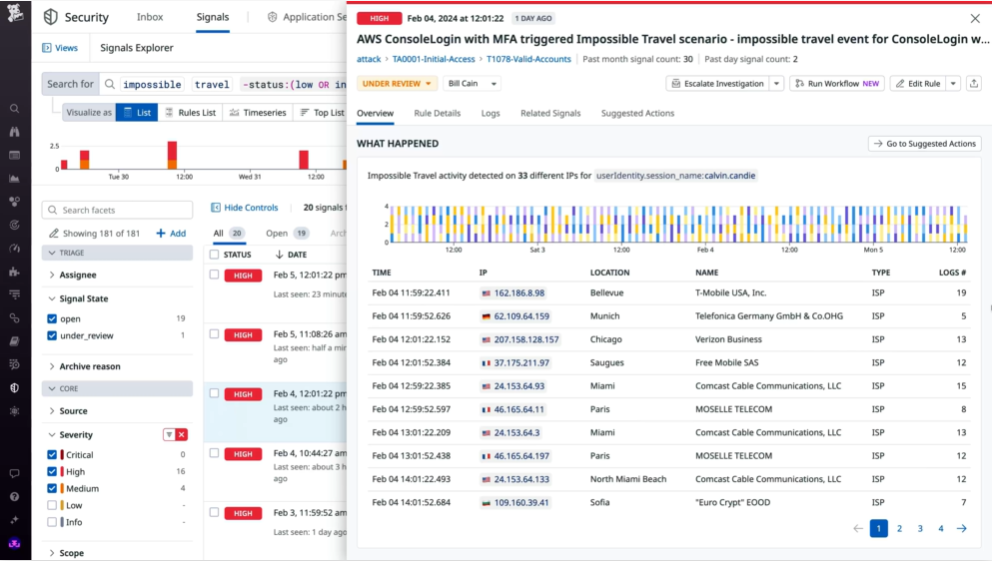
The platform runs on real-time telemetry. It evaluates freshness, volume, and schema changes alongside service health indicators, resource contention, and pipeline performance.
This singular view helps enterprise teams understand the operational impact behind a data anomaly beyond simply alerting to it.
Datadog integrates with ingestion frameworks, orchestrators, compute engines, and processing systems.
Pipeline activity is observed within the same dashboards and alerting workflows used for application monitoring.
When pipelines and applications share environments or resource pools, Datadog provides the context needed to correlate and understand data behavior and quality across the layers.
Key differences from Anomalo
- Unified telemetry: Combines logs, metrics, and traces for real-time correlation between data incidents and application or infrastructure events.
- Service-aware pipeline monitoring: Tracks pipelines within the same observability workflows used for distributed applications and microservices.
- Real-time architecture: Surfaces anomalies as they occur, rather than on warehouse-centric schedules.
- Operational dashboards and alerts: Integrates data signals into existing operational workflows, reducing tool and context switching.
- Deep infrastructure insight: Highlights resource contention, service failures, and environmental factors that often precede data issues.
Why choose Datadog over Anomalo
For enterprises that need real-time telemetry and cross-domain visibility, Datadog provides the observability that Anomalo lacks.
Splunk
Rating ⭐⭐⭐⭐⭐
Splunk’s defining strength is its ability to handle high-volume, high-velocity machine data at a scale most platforms can’t match.
Logs, metrics, and traces are captured at nearly the same speed they're generated, providing critical in-the-moment understanding of what's happening, right now.
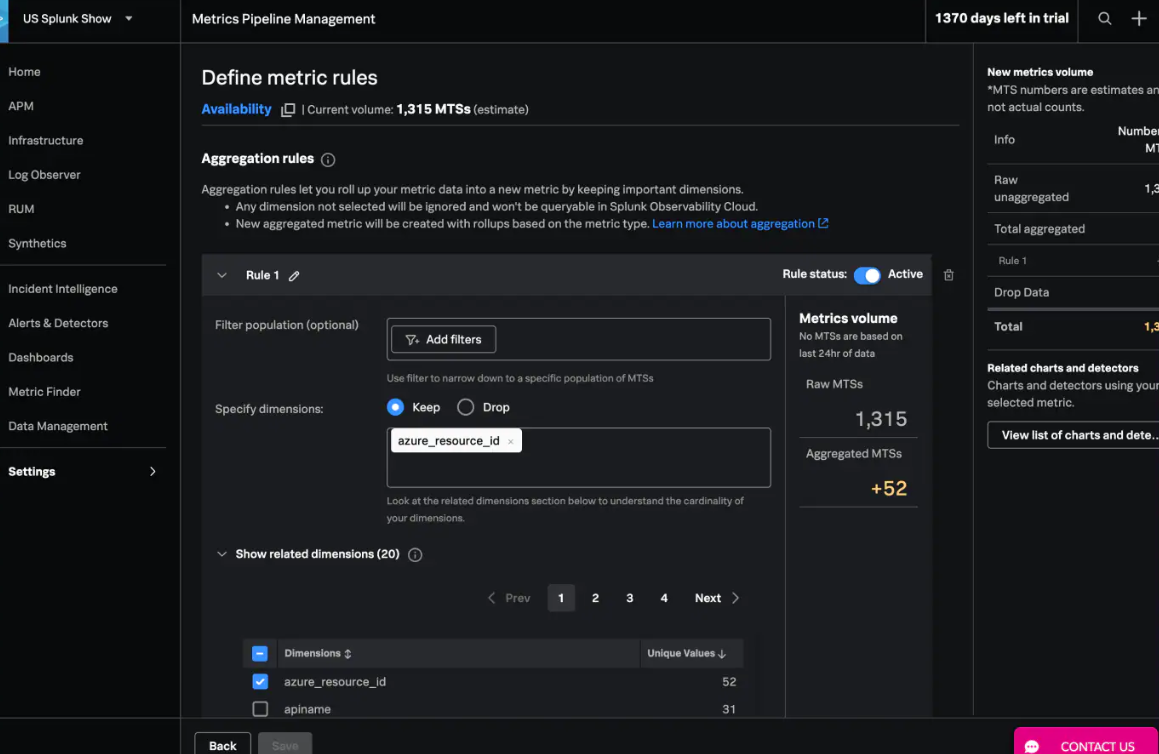
It pulls telemetry from applications, services, infrastructure, and pipeline components, indexing everything for fast search and correlation.
Using Splunk's own query language, users can trace patterns across distributed systems, connect operational behavior to data workflows, and diagnose issues the moment they occur.
Splunk marries high-volume telemetry into a single operational window. Pipelines, services, and the infrastructure supporting them live alongside broader operational systems in shared dashboards and alerting workflows.
That makes Splunk a strong fit for environments where data reliability depends on infrastructure behavior or where regulatory and audit requirements demand granular, real-time visibility.
Key differences from Anomalo
- Real-time detection: Issue detection as they occur.
- Unified operational telemetry: Combines logs, metrics, traces, and pipeline signals into one environment.
- Deep root cause context: Shows whether incidents stem from code changes, infrastructure pressure, or upstream system events.
- Operational query language: Enables rapid investigation across distributed systems and high-volume workloads.
- Compliance-ready visibility: Supports environments that require fine-grained, time-sensitive operational auditability.
Why choose Splunk over Anomalo
Choose Splunk over Anomalo when data reliability is inseparable from application and infrastructure health, and your priority is real-time investigation across complex, distributed systems.
Do You Need An Alternative to Anomalo?
The question isn't whether Anomalo works. It does.
Anomalo is a solid choice for mature data infrastructures that want fast, low-config data quality monitoring.
The real question is whether data quality monitoring alone can support your expectations for data quality and reliability. For most enterprises, the answer is no.
Most enterprises need true observability that connects data quality with pipeline behavior, infrastructure performance, downstream usage, and business context.
That's where Sifflet stands out as the strongest alternative to Anomalo.
Sifflet’s end-to-end observability, field-level lineage, and business-aligned context make it the strongest fit for enterprises that need more than anomaly detection.
Book a demo today and see how Sifflet brings full-stack visibility, faster diagnosis, and connects business context to your data.





-p-500.png)
