


If you're a data engineer, you probably feel like your whole job is babysitting the Big Green Board.
After all, 80% of your time is surely spent keeping data quality instead of working on new features.
However, a green pipeline doesn't necessarily mean that the data running through it is OK.
Standard monitoring only tells you the process finished, not whether the output is garbage. So, how do you protect your stack against the silent failures? We’re talking about schema drifts and volume drops that won’t trigger an error code but will absolutely trigger a crisis.
Kick back in that questionably ergonomic chair and let's talk about what data observability can do for a data engineer like you.
Data Engineers Need Observability
In the life of a data engineer, observability is the difference between dropping everything to firefight the latest data issue and actually spending time working on the architecture projects you were hired to build.
Data observability takes on much of the routine, but time-consuming triage and investigative work, so you don't have to.
- Observing ingestion and inbound quality
You're managing dozens of connectors from Postgres, S3 buckets, or third-party APIs.
Yet, when source teams drop columns or change schemas upstream, those connectors faithfully sync the broken schema straight to your staging layer, crashing your dbt models in mid-transformation.
Observability catches schema drift at the source. The platform pings you the moment metadata changes happen, before bad schemas hit staging.
- Transformation and logic
You're writing dbt and SQL to turn raw data into something useful. Your tests pass, and the model builds fine.
But nulls in source fields or unexpected duplicates cause silent disruptions that won't be obvious until they’ve already poisoned your production tables and triggered an executive fire drill.
Fortunately, a data observability framework spots these distribution anomalies in real-time, saving you from hours of tedious investigative work.
- Incident response and root cause analysis
The 7:49 AM Slack ping: Hey. The revenue dashboard looks off.
Welcome to the Fire Drill. Look at the query history. Check last_altered dates. Manually trace dependencies table by table.
How much of your morning did that sop up?
Data observability accelerates detection, investigation, and RCA, with field-level lineage pinpointing the exact upstream table or faulty join in minutes, not hours.
- Downstream impact analysis
How many times have you held your breath before you hit deploy? While you’re trying to fix this, will it break that?
Your choice of processes: manually hunting through BI tools, Slack channels, and dbt docs for dependencies, or just crossing your fingers and hoping.
Observability’s automated lineage traces to exactly which dashboards, BI tools, and ML models depend on that table. So, go ahead and make that change with confidence.
Because when you move from "hoping" to "knowing," you aren’t just saving your afternoon, you’re securing the foundation for every major business decision.
The High-Stakes Grind of Data Engineering
After all, your work powers multimillion-dollar decisions, backs executive credibility, and protects the value of data. among many another things.
High-stakes calls on marketing budgets, acquisitions, and product launches rely on revenue metrics and customer cohorts from the warehouse tables and dbt models you built. If the data is wrong, the decision is wrong.
C-level confidence requires absolute data reliability. Every time the CEO presents to the board, they’re putting their reputation on the line: your pipeline.
Poor data quality costs businesses $12.9 million annually in rework, lost revenue, and manual auditing. It's schema validations, volume checks, and freshness monitors that insulate against these profit drains.
But it's not all accolades and applause, now is it?
There are plenty of challenges that present themselves throughout your daily grind:
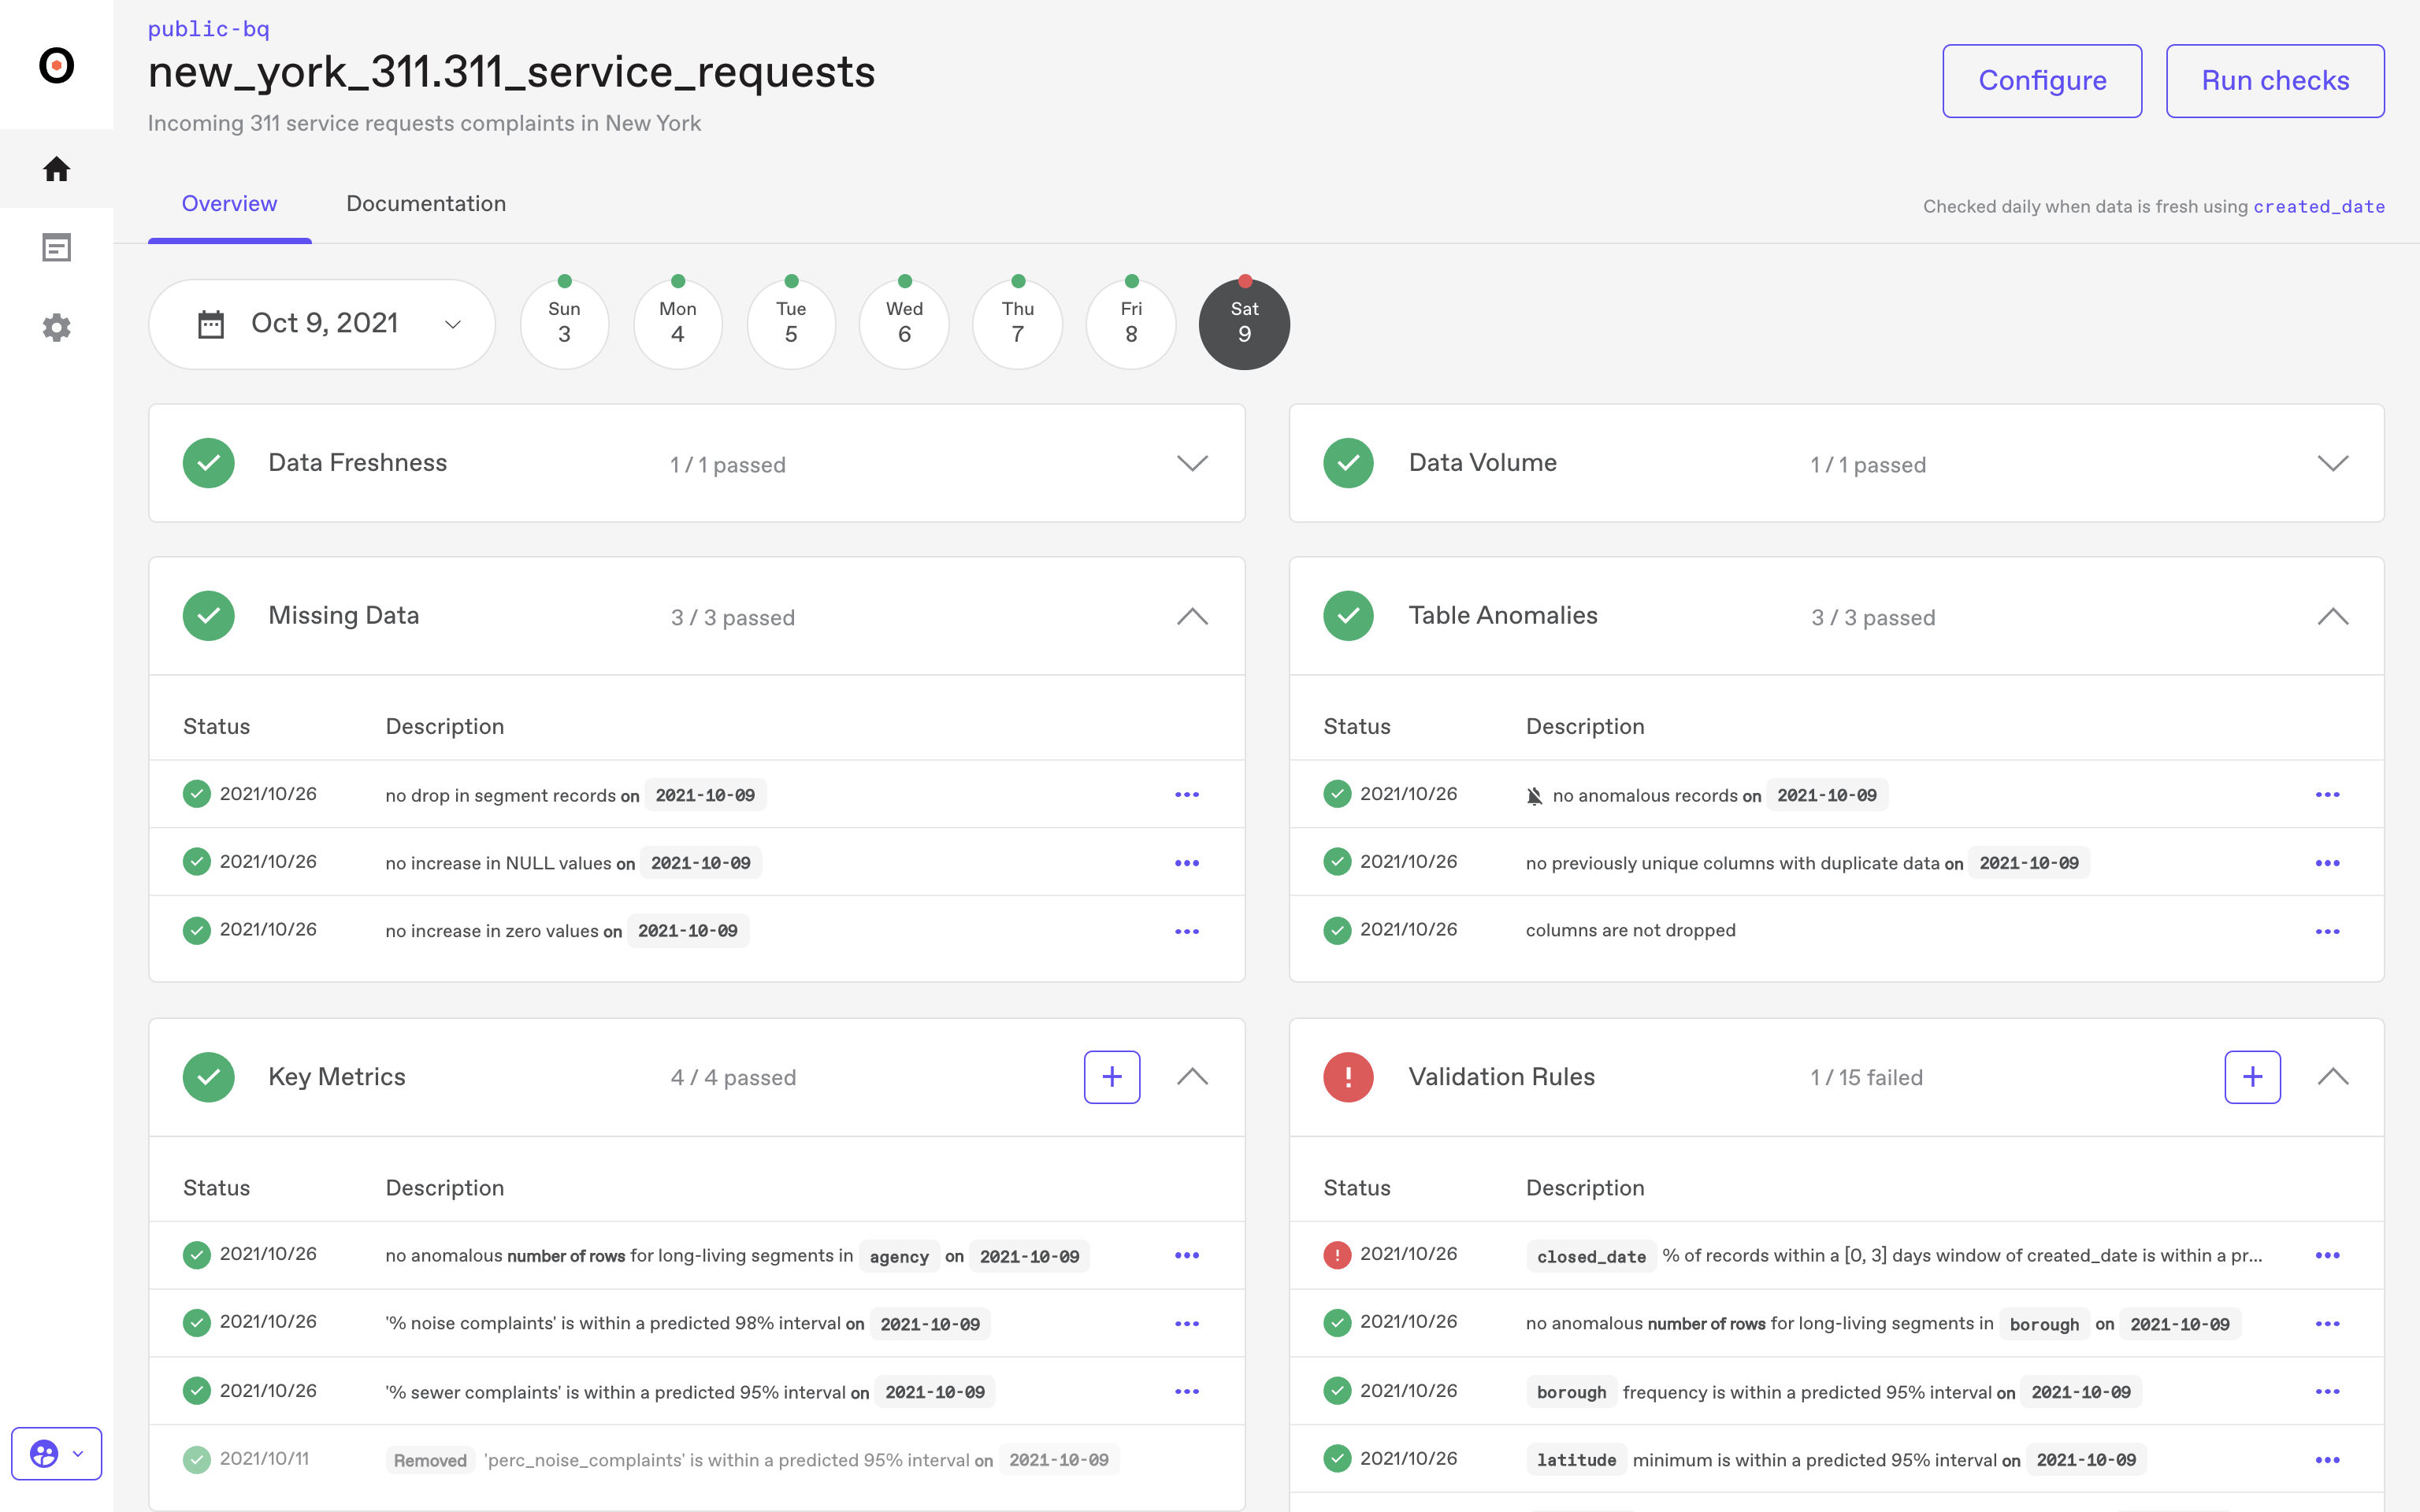
1. The False Sense of Success. The green board doesn't even hint at a partial load or empty table.
2. Maintenance Mayhem. Spending 80% of your week patching brittle joins and legacy pipelines.
3. Upstream Volatility. Being the last to know when a source team renames a column or changes a data type.
4. Lineage Blindness. The fear of hitting deploy when you don't know which executive dashboards or automated tools depend on the asset you're touching.
5. The Moving Goalpost. 'Available' isn't enough anymore. Now, data has to be clean, low-latency, and fresh for real-time operational decisions.
6. Alert Fatigue. The Big One slips through when it's hidden among 50 meaningless alerts.
7. The Context Gap. Playing Data Detective. You spend hours figuring out if a 20% volume drop is a catastrophic bug or just another bank holiday in the UK.
To stop playing detective and start building, you need a framework that monitors the vitals for you.
The 5 Pillars of Data Observability for Engineering Teams
If you're going to maintain a healthy architecture, skip the basic heartbeat checks and get observability that covers every possible failure mode.
1. Data Freshness (SLAs and Latency)
Data has a shelf life.
Sure, you're checking if the job ran, but you also want to make sure the data itself is actually fresh.
Observability sends an alert when the data isn’t flowing before analysts and scientists realize they're looking at yesterday's news.
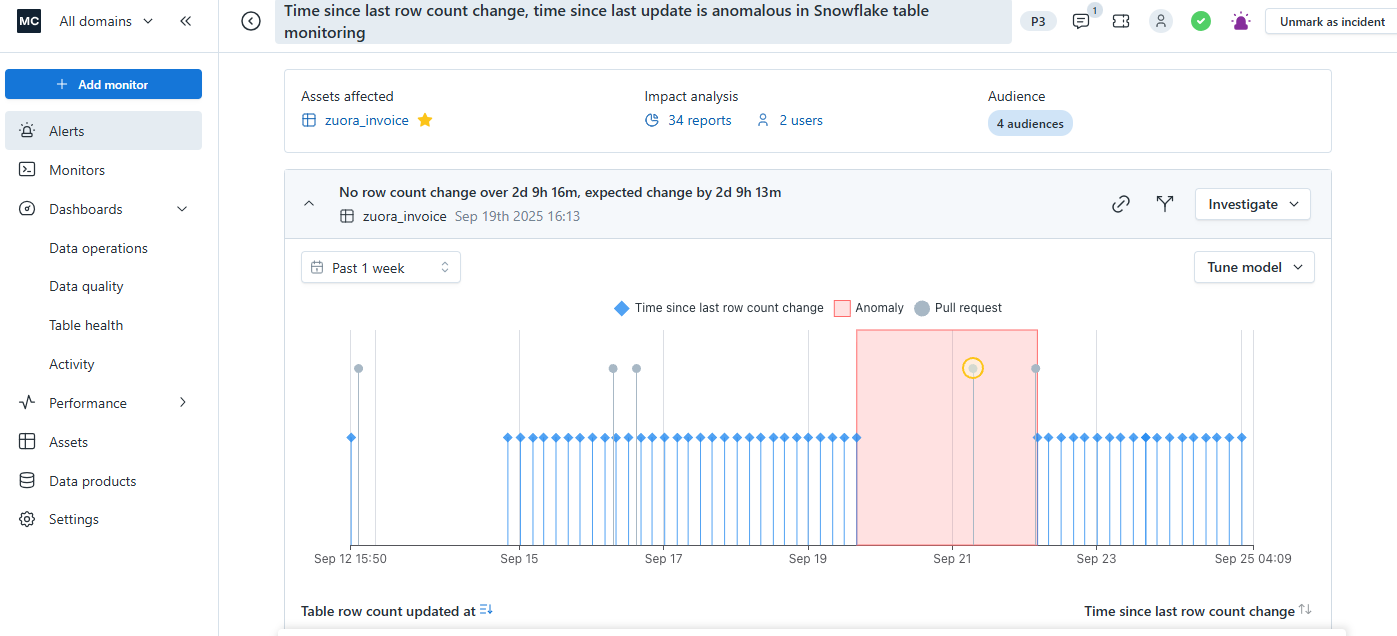
2. Data Volume (Anomalies and Row Counts)
You need to know if the amount of data arriving matches reality. Sure, the job technically succeeded, but if your ingestion usually brings in 100k rows and today it brings in 50, well, something has obviously gone awry.
Observability flags these anomalies automatically before the Finance team runs its end-of-month reporting.
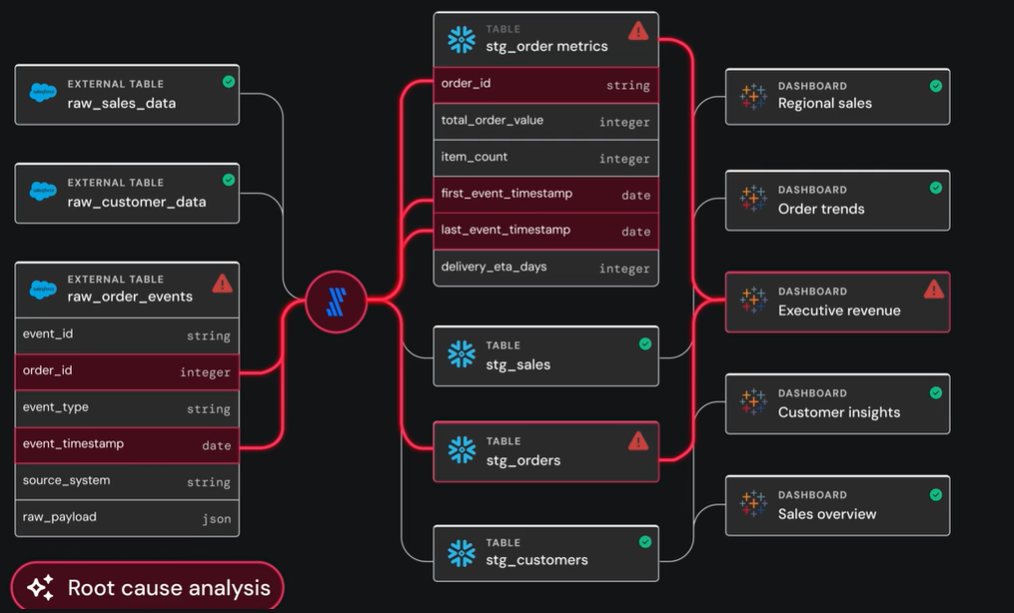
3. Data Lineage
Lineage is the map that makes troubleshooting (and sleep) possible. Otherwise, you're just looking at a broken data asset in a total vacuum. Sure, you can see that a specific table is failing, but you need to know exactly where that data came from and who's using it.
Observability traces bugs back to their source and shows you where and to what the damage radius extends.
4. Schema Changes (Detecting Schema Drift)
Schema drift is the silent killer. And soul crusher, to be honest.
An upstream team renames a column or changes a data type without sending anyone a heads-up. Sure, your code worked yesterday, but today? It’s broken.
With observability? You catch the change at the ingestion stage instead of the production table, saving your entire morning from a debugging fire drill.
5. Data Quality
Data quality is what’s actually happening inside your rows, the stuff a standard unit test won't catch. You might have a test to ensure a field isn't null, but what if a bug causes 40% of your values to suddenly become "N/A" or "0"? Your pipeline is green, but your data is useless.
Observability learns your data’s normal habits. It pings you the moment the numbers start looking suspect, catching errors before they poison a downstream ML model or an executive's slide deck.
These pillars provide the structural framework for a healthy stack. But why is this shift from manual checks to automated observability actually a career-saver for the person sitting in the chair?
Why Data Engineers Prioritize Observability
If you were only building linear, three-step pipelines, you could probably survive on a few assert statements and a prayer. But today's data stacks are living, breathing ecosystems.
You need observability because you can't build a 100% fail-proof system. But you can build one that tells you exactly where it's bleeding before the business feels the pain.
- Full-stack visibility
As your stack grows to include hundreds of dbt models, several S3 buckets, and a mess of SaaS APIs, how do you trace the health of the entire map?
Observability gives you a unified view. You aren't just monitoring individual tasks in isolation; you’re seeing the entire data lifecycle in one place.
- Catching the unknown unknowns
Manual testing is great for the things you expect to break (like a missing ID). But what about the things you never saw coming?
How about when an upstream API change suddenly starts sending '0' as a string instead of an integer for the transaction_amount field? Your SQL logic technically works by casting it, but your revenue metrics just dropped to zero across the board.
Data observability learns your data's unique fingerprint. It automatically flags these distribution anomalies, noticing logical errors that no manual test would have anticipated.
- Automated root cause analysis (RCA)
The most expensive part of your day isn't writing code, it's fixing things that break.
When an analyst reports that a dashboard is broken, it usually means hours of manually tracing dependencies and checking last_altered dates to find the culprit.
Observability does the detective work for you. It points directly to the source of the problem, showing you that a schema change in an upstream staging table three steps back is what poisoned the downstream metrics.
You spend ten minutes fixing the bug instead of two hours playing detective.
- Scaling without the burnout
The company might be growing, but the engineering team isn’t. It’s hard to keep pace with writing manual tests for every new asset.
Data observability scales your team without scaling your anxiety. It’s an automated safety net that monitors your entire asset inventory 24/7, so you're paged only when there’s a real fire to put out.
Sounds great, right? Let’s talk about the platforms that do a lot of the heavy lifting for you.
The Best Data Observability Tools for Engineers
Are you fighting pipeline downtime, deep data quality issues, or a lack of business context? Choosing the best tool means determining where your pain is greatest.
Here are a few observability tools that offer the best value for data engineers.
1. Sifflet: The Business-Aware Architect
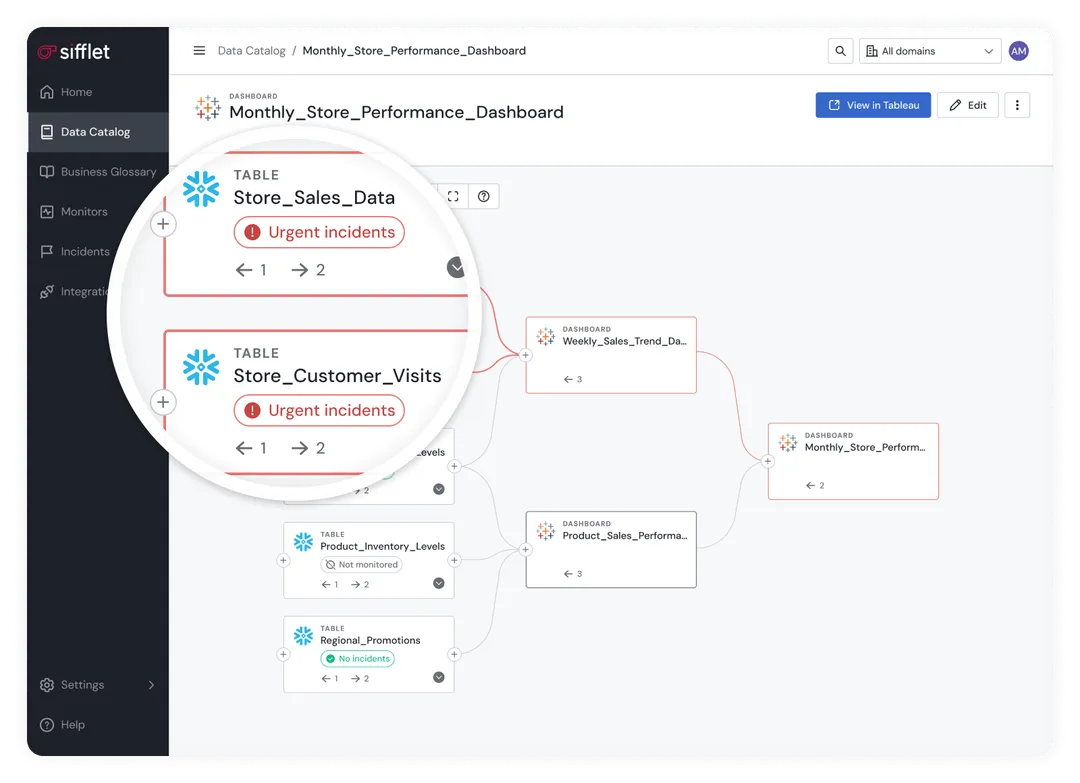
Tired of being a ticket-taker for business teams? Sifflet has your back as the most business-aware data observability tool. It connects data issues to their business context downstream, prioritizing issues by business impact to get the important things back on track fast.
The Agent Edge. Sifflet focuses on automating the investigative loop. It uses three AI agents to handle the 'detect-triage-resolve' cycle, analyzing historical incident patterns to suggest root causes. For the DE, this means less time digging through Snowflake Query History and more time seeing how a broken upstream pipe affects a downstream metric.
Why DEs love it: Sifflet maps your technical assets directly to business KPIs. When a column drifts, Sifflet alerts and shows you which executive dashboard is about to break.
2. Monte Carlo: The Data Downtime Pioneer
Monte Carlo is one of the oldest names in the space. It's best for large-scale enterprise environments where the volume of tables makes manual testing a non-starter.
The Edge: Monte Carlo prioritizes automated discovery, using machine learning to set baselines without requiring every check to be written in YAML or SQL.
The DE Win: Its strongest feature is its automated lineage, mapping dependencies across your entire warehouse and BI layer.
3. Anomalo: The Deep-Dive Specialist
Anomalo is best for engineering teams that need to go deep into the actual values and distribution patterns of their most critical tables.
The Edge: Anomalo uses machine learning to detect data drift and distribution shifts. If a column suddenly has a 20% spike in nulls or a weird shift in its mean value, Anomalo sees it and alerts to it.
The DE Win: Instead of just alerting that a table is suspect, Anomalo identifies the specific data segments or rows causing the anomaly, saving you hours of manual investigation.
Still not sure how to choose?
Choosing a Data Observability Platform
Here's a quick view checklist to help you determine which platform might align best based on your most painful pain points:
- Do you need more than just simple monitoring?
If you need deep visibility into how data issues impact your business, choose Sifflet. Its business-aware lineage connects technical assets to C-suite KPIs and other critical business processes.
- Is your pipeline complexity becoming unmanageable?
If you have thousands of tables and need a battle-tested incident management workflow, consider Monte Carlo. It's the PagerDuty for data that scales with enterprise chaos.
- Are you seeing silent failures in the actual data values?
If your schemas look fine but your data distributions are drifting, check out Anomalo. Its focus on deep-data quality is second to none.
Regardless of which tool you pick, make sure it can clear each of these four hurdles:
- Agentic Automation: Does it use AI agents to suggest monitors and perform root cause analysis, or are you still the one doing all the manual detective work?
- Developer Experience (DX): Can you configure it via YAML or an API? If you can't version-control your observability, it's not an engineering tool—it's a chore.
- Integration Breadth: Does it connect to your entire stack (Airflow, Snowflake, Fivetran, etc.) or just a few isolated parts?
- Signal-to-Noise Ratio: How good is its anomaly detection? The last thing you need is a tool that floods Slack with more false alarms.
Observability for Data Engineers
You didn't choose data engineering to spend your days digging through Snowflake Query History.
You want to build. You want to design scalable architectures, optimize performance, and ship features that move the needle.
Observability is your best friend in pursuit of that goal. It acts as your automated safety net, catching the silent failures and upstream chaos before they reach the dashboard.
By shifting from reactive firefighting to proactive engineering, you can reclaim your roadmap and your sanity.
Ready to automate the daily engineering grind?


-p-500.png)
